


May 1, 2024
Autopsy of a Perfect Policy Failure: The Closure of Indian Point
May 1, 2024

Indian Point Energy Center, Daniel Case, CC BY-SA 3.0, via Wikimedia Commons
Key Findings
- Since the closure of Indian Point, New York has become more dependent on natural gas for electricity generation. In 2017, natural gas contributed to 39 percent of the state’s electricity generation. In 2023, natural gas contributed over 50 percent of the state’s electricity generation.
- The median price of electricity in New York was $24.70 per MWh from 2017 to 2023. In 2022, the price of electricity spiked to $45.39 per MWh, a 83.77 percent increase over the median. The closure of Indian Point left New Yorkers exposed to volatile natural gas prices and prices spiked due to Russia’s invasion of Ukraine and subsequent international sanctions.
- New York City is now more vulnerable to extreme weather events, particularly a severe or prolonged heatwave. New York City is not prepared for a heatwave with temperatures above 102 degrees any time in the next decade and may struggle at temperatures above 98 degrees. Policymakers must take action to reduce the risk of rolling blackouts during the next heatwave.
- According to our model, if Indian Point had remained operational, New York would have produced 8.03 fewer metric megatons of CO2 in 2022. The plant’s closure complicates New York’s decarbonization goals, especially downstate, which is reliant on natural gas to maintain grid reliability. Over 95 percent of all power generation in downstate came from natural gas in 2022.
- According to our model, New York ratepayers endured an additional $258 million to $304 million in marginal electricity costs in 2022 due to the closure of Indian Point. However, significant savings in 2023 were unlikely due to lower natural gas prices.
Executive Summary
The decision to shutter Indian Point Nuclear Power Plant has profoundly altered New York’s energy landscape, significantly increasing the state’s reliance on natural gas and affecting electricity costs and reliability. Indian Point reactors 2 and 3 ceased operations on April 30th, 2020 and April 30th, 2021, respectively. This report analyzes the repercussions of the plant’s closure by analyzing New York Independent System Operator (NYISO) data from 2017 to 2023, highlighting critical shifts in fuel mix, marginal electricity prices, carbon emissions, and grid reliability.
Indian Point energy center generated 2083 MW of low-carbon baseload power for New York. The void left by Indian Point’s closure was filled by increased output from natural gas and dual fuel power plants. As a result, New York has higher carbon emissions from electricity generation. According to our model, in 2022, New York generated an additional 8.03 metric megatons of carbon emissions than it would have if Indian Point had continued operations. In 2023, natural gas and dual fuel power plants generated 50.5 percent of all electricity and 97 percent of all carbon emissions on NYISO. While the remaining nuclear power plants generated 22 percent of all electricity and 1 percent of all carbon emissions. The closure of Indian Point will make it more difficult for New York to decarbonize its electrical grid. In 2022, over 95 percent of all power generation in downstate came from natural gas and fossil fuels.
The closure of Indian Point has exposed New Yorkers to volatility in the price of natural gas. In 2022, following the plant’s shutdown, median electricity prices surged by over 83 percent. New Yorkers have experienced severe inflation over the past few years that was exacerbated by the closure of Indian Point. The Joint Economic Committee found that the monthly household costs for a family in New York State rose $500 between January 2021 and November 2022. If New York aims to fulfill its goals of decarbonizing its electricity generation, ratepayers can expect that their utility bills will continue to rise.
Indian Point’s closure has also exacerbated reliability issues, particularly for New York City. Projections indicate that the city is underprepared for extreme weather conditions, which could lead to rolling blackouts during severe weather events. Heatwaves pose substantial risks to the public, especially to vulnerable populations with pre-existing health conditions and lower-income New Yorkers. Moreover, during Winter Storm Elliott in 2022, New York City almost experienced a disastrous failure of its natural gas distribution system, which highlights the critical need for investment in robust energy infrastructure to protect residents from extreme weather.
The closure of Indian Point demonstrates the drastic consequences of shutting down even one nuclear power plant. This analysis has implications not only for New York State’s energy policy, but for the future of other localities throughout the United States. New York must now grapple with greater natural gas dependency, higher emissions, higher price volatility, and significant reliability challenges. Lawmakers must pursue a prudent strategy that will ensure New Yorkers have access to an abundance of affordable, clean, and reliable energy.
Summary of Policy Recommendations
- Keep existing nuclear power plants online.
- Streamline processes to approve new reactor designs.
- Remove barriers to building new energy infrastructure and secure critical supply chains.
- Abandon policy proposals that will further undermine grid reliability and pursue energy policy that prioritizes reliability and affordability.
- Mitigate potential harm from rolling blackouts during a summer heatwave.
- Ensure the timely completion of the Champlain Hudson Power Express.
- Study the negative externalities of the Inflation Reduction Act on grid reliability.
Background
Consolidated Edison (ConEd) was the first company to build a commercial nuclear power plant in New York State. ConEd purchased the land that would become the Indian Point Energy Center in 1952. The Atomic Energy Commission — the predecessor to the current Nuclear Regulatory Commission (NRC) — approved the permits to begin construction in 1956. Indian Point Energy Center initiated commercial operations in 1962 with a 275-megawatt (MW) reactor (reactor one).
ConEd approved plans in 1965 and 1967 to build two additional pressurized water reactors. These reactors began operations in 1974 and 1976, respectively. (Although reactor one operated without severe incidents for over a decade, ConEd ceased its operations in 1974 because its emergency core cooling system did not meet the NRC’s regulatory requirements.) Reactors two and three had a combined capacity of 2,083 MW and had an average output of 1,937 MW over the last decade they operated. For context, New York City consumes an estimated 5,500 MW of power on an average day and more than 10,000 MW at peak demand. Indian Point’s two remaining nuclear reactors generated enough electricity to power over 1.3 million average American homes.
Indian Point Energy Center is 36 miles north of Midtown Manhattan, in Westchester County along the Hudson River. Over nearly six decades of operation, Indian Point’s managers defended its continued operation against lawsuits and complaints from hostile environmental groups, government officials, and regulators. Opponents feared that a meltdown at the power plant would threaten New York City and plant operations would harm the Hudson River. Those fears turned out to be overwrought; reactors two and three cumulatively operated for 91 years without serious incident. Nevertheless, Indian Point ceased operations in 2022.
Introduction
Shuttering the Indian Point reactors in 2021 and 2022 caused significant, measurable harm to families and businesses in New York State. In 2022, New Yorkers paid high prices for electricity, which devastated many household budgets. New Yorkers’ energy bills were higher than they would have been if Indian Point had continued to operate. Energy inflation is particularly harmful for lower-income Americans, as energy makes up a more significant proportion of their cost of living.
Furthermore, Indian Point’s closure made New Yorkers more vulnerable to extreme weather events and more dependent on natural gas for their electricity needs. As natural gas replaced Indian Point’s low-carbon energy, New York State’s carbon emissions have risen significantly.
Additionally, New York City residents now face potential rolling blackouts when they most need protection from extreme weather. It is an understatement to say that the energy policy state lawmakers advanced failed and unnecessarily denied their constituents affordable, low-carbon, and reliable energy.
This in-depth analysis of the costs of closing Indian Point is a case study for policymakers as they consider the future of America’s power generation and fuel mix. As our analysis shows, ineffective energy policy has severe negative consequences for the residents of a state or region, particularly lower-income households. The consequences of shutting down even a single power plant can echo far into the future.
Indian Point’s closure made New Yorkers more vulnerable to extreme weather events and more dependent on natural gas for their electricity needs. As natural gas replaced Indian Point’s low-carbon energy, New York State’s carbon emissions have risen significantly.
Nuclear power plants safely produce reliable, affordable, and dispatchable power that is difficult to replace. Indian Point enabled the New York Independent System Operator (NYISO) to maintain grid reliability, limit carbon emissions, and insulate businesses and families from global energy market volatility.
In the years following Indian Point’s closure, the fuel mix and market dynamics of New York’s electrical grid have changed in dramatic and measurable ways. NYISO has concluded that New York City faces a heightened risk of rolling blackouts during a severe heat wave. The share of fossil fuels in the electricity mix has increased, resulting in higher carbon dioxide and greenhouse gas emissions in the New York City metropolitan area. New Yorkers are also much more vulnerable to spikes in natural gas prices.
Indian Point’s energy provided economic and environmental value. New York’s problems since closing the plant illustrate the challenges of out-of-date energy policy in the face of fast-rising demand.
NYISO grid fundamentals
Any electrical grid should be able to meet its peak power demand. For each power system, demand and supply must balance. If the electricity the power plants send to the grid exceeds demand, plant operators must curtail the excess power. If the frequency rises too high, the independent system must return the frequency to 60 Hz to protect critical equipment.
When demand exceeds supply on the electrical grid and insufficient power enters the system, the ISO needs to ration power. Families and businesses feel this rationing in the form of brownouts, rolling blackouts, and spikes in the cost of electricity. Blackouts are inconvenient for most people, but they can be life-threatening during heat waves and winter storms when the outages are most likely to occur. During a sustained extreme weather event, demand for heat or air conditioning can spike and threaten vulnerable infrastructure. During a heat wave, the lack of wind may cause problems for grids that rely on wind power to meet demand. Natural gas plays a dual role in heating and electricity generation, making its efficient distribution critical to grid reliability.
Indian Point’s energy provided economic and environmental value. New York’s problems since closing the plant illustrate the challenges of out-of-date energy policy in the face of fast-rising demand.
The electrical grid must deliver power in a consistent and reliable manner. The public expects a flow of electricity that provides the power for indoor climate control, lighting, food refrigeration, and other necessities. Families and businesses do not want to be surprised by exorbitant bills at the end of the month. Outside of localized transmission issues — such as a downed power line knocking out power to a neighborhood — localities are most vulnerable to outages during periods when demand for power exceeds the available supply.
On NYISO’s grid, power producers bid into auctions every five minutes to meet the demand for the upcoming five minutes. When the auction clears, NYISO publishes this auction data in a comma separated values file that includes the date, time, and megawatt (MW) capacity for each fuel category for the five-minute interval. NYISO reports data on the following fuel categories: nuclear, hydroelectric, natural gas, dual fuel, wind, other renewables, and other fossil fuels.
Dual fuel is the most important category because it is one of the largest contributors to the power mix in any given month. A dual-fuel generator has the ability to use multiple types of fossil fuels: typically natural gas, diesel, fuel oil, or propane. These power generators can switch between fuels in response to changes in price and other conditions that affect operations. NYISO monitors fossil fuel generators that have dual-fuel capability because they are critical to maintaining grid reliability during times of peak demand. A dual-fuel power plant can store liquid fossil fuels onsite to meet peak demand in real time. Some of these plants are ‘peaker plants,’ meaning they run only at times of peak demand to profit from the higher revenues available when the grid needs additional electricity most acutely.
In contrast to a dual-fuel plant, a traditional natural gas power generator’s output is limited by the maximum rate at which natural gas can flow into the plant. In its gaseous form, natural gas is not often stored onsite in large quantities because it is much more costly and dangerous to store than other fossil fuels. At times when the price of natural gas surges higher than the price of fuel stored onsite, a dual-fuel power plant has the ability to switch to a cheaper fuel source to maximize profit.
Following the closure of Indian Point, New York has three remaining operational nuclear power plants. All three of the power plants are located in western New York and use Lake Ontario as their source of cooling. James A. Fitzpatrick, Ginna, and Nine Mile Point nuclear power plants have a combined nameplate capacity — total potential output — of 3,412 MW. These nuclear power plants generate over 20 percent of all electricity in New York State.
The “other fossil fuel” and “other renewables” categories make up a trivial amount of all power generated on the NYISO grid. Diesel generators, fuel oil, or other less commonly used fossil fuels for electricity generation make up the other fossil fuels category. These power generators only run when the price of power spikes due to shocks in demand or supply. Similarly, other renewables refers to solar, biomass (wood and organic waste), or other non-wind renewable power generation.
NYISO imports electricity from neighboring states and Canada, accounting for approximately two to five percent of all its electricity. For the purposes of our analysis, we have focused on power generation within New York State and ignored the marginal contributions of imports. Power plants located in New York State will be more reliable sources of power than imports during times of peak demand, as discussed below.
The decision to shut down Indian Point
In 2017, Entergy, the company that owned and operated Indian Point, negotiated a deal with New York’s attorney general and Riverkeeper, an activist environmental group, to gradually shut down the facility over 2020 and 2021. Entergy’s president said the company spent $200 million and over a decade battling the state for permission to renew their licenses to operate the reactors. Activist groups had sued Entergy to prevent the renewal, citing environmental and safety concerns. Then-governor Andrew Cuomo referred to Indian Point as a “ticking time bomb” and acknowledged, “I have personally been trying to close it down for 15 years.” Although no deaths have been attributed to the radioactive release following the meltdown at Fukushima Daiichi in Japan in 2011, activists used the incident to amplify fear about Indian Point’s proximity to New York City. Reactors two and three operated without a severe incident for 91 reactor years and continually earned the approval of the Nuclear Regulatory Commission.
Entergy cited economics as the ultimate reason for shuttering the reactors. Natural gas prices lowered the price of electricity, particularly in downstate New York, reducing Indian Point’s revenues. While Indian Point helped maintain grid reliability and provided low-emissions electricity downstate, this value was not reflected in the plant’s bottom line.
In 2017, Governor Cuomo’s office estimated that the shutdown would add only three dollars per month to the electric bills of downstate New Yorkers. In 2022, spikes in natural gas prices not only left families with higher utility bills, but forced them to absorb the higher energy prices that local businesses passed onto their customers. According to a state-by-state analysis of inflation trends by the Joint Economic Committee, monthly household costs for a family in New York State rose $500 between January 2021 and November 2022. This data does not include the spike in electricity prices that occurred during winter storm Elliott in December. The consequences of shutting down Indian Point are worth exploring in great detail, not only as a warning to other localities, but as a glimpse into the costs of burdensome federal nuclear regulations that inhibit growth in the nuclear sector.
Peak analysis
We conducted a peak analysis to analyze NYISO’s fuel mix. A peak analysis reveals how the grid’s composition has changed over time and which resources on the grid are most critical to maintaining reliability.
To conduct our analysis, we cleaned and aggregated NYISO production data from their website. Our data set begins on January 1st, 2017, and ends on December 31st, 2023. From that data, we calculated the number of gigawatt hours (GWh) of electricity generated by each fuel category for each month. After determining the monthly outputs for each fuel category, we identified the months of peak electricity generation for each year. For each of the years in the data set, either July or August was the month of peak power generation, as New Yorkers needed more power to run their fans and air conditioning, maintain their swimming pools, and meet other summer-specific demands.
There are a few key takeaways from our peak analysis. Output from nuclear power dropped significantly after the closure of Indian Point. Output from renewables during peak months, however, stayed essentially flat. At present, solar and wind power do not play a significant role in NYISO during times of peak demand. Hydroelectric power provided a consistent baseload of electricity that was critical for maintaining reliability, although its output varied from month-to-month and year-to-year.
There were several shocks throughout the observed period. The COVID pandemic and associated lockdowns caused major temporary shifts in demand and revealed supply chain dependencies. Russia’s invasion of Ukraine in February 2022 and the consequent energy sanctions had a dramatic impact on the cost of fossil fuels, particularly natural gas. Lawmakers are actively concerned that their constituents will not have access to the energy resources and critical minerals they need — this was the first priority of Congress in 2022.
In New York, the price of gas as it entered the local distribution system rose to an average of $104.13 per MWh in August 2022, up from $76.78 the year before. An average New York City ratepayer saw their electricity bill increase by more than 22 percent from winter 2021 to winter 2022, largely due to high natural gas prices. Electricity bills will continue to rise as ConEd invests in new infrastructure to help meet demand and ensure reliability. State and federal-level policy decisions have changed the composition of power generators on the NYISO grid. Despite these higher prices, the shutdown of the Indian Point reactors led to considerable increases in the proportion of power generated by natural gas.
In 2017, Governor Cuomo’s office estimated that the shutdown would add only three dollars per month to the electric bills of downstate New Yorkers. In 2022, spikes in natural gas prices not only left families with higher utility bills, but forced them to absorb the higher energy prices that local businesses passed onto their customers. According to a state-by-state analysis of inflation trends by the Joint Economic Committee, monthly household costs for a family in New York State rose $700 between January 2021 and November 2022.
In July 2017, the greatest contributor of electricity to the NYISO grid was nuclear power. Nuclear power plants generated 3,918 GWh of electricity, or 30.2 percent of all power generated on the grid. July 2017 was the peak month in our data set when nuclear power generated its greatest percentage of total power to the grid. Natural gas power plants generated 2715.78 GWh of electricity, or 20 percent of all power generated on the grid. Dual-fuel plants generated 3281 GWh of electricity, or 25.3 percent of all power on the grid. July 2017 was also the peak month in our data set that had the least electricity generation for both natural gas and dual fuel, with dual fuel making up its lowest percentage of total power generation. Hydroelectric power generated 2,614 GWh, or 20.1 percent of all power on the grid. This was the peak month when hydroelectric power generated the most electricity. During this month, the affordable baseload power from nuclear and hydroelectric power plants reduced the demand for natural gas during peak demand on NYISO.
In July 2023, the greatest contributor of electricity to the NYISO grid was dual fuel. Dual-fuel power plants generated 4,799 GWh, or 34.8 percent of all power generated on the grid. Natural gas generated 3,702 GWh, or 26.7 percent of all power generated on the grid. This was the greatest output in GWh for both natural gas and dual-fuel power plants during a peak month. The three upstate nuclear power plants referenced above generated 2,437 GWh, or 17.6 percent of all power generated on the grid. Hydroelectric power generated 2,363 GWh, or 17.1 percent of all power generated on the grid. Hydroelectric power generated 252 fewer GWh than in July 2017. Nuclear power generated 1,482 fewer GWh of electricity than in July 2017, a decline of 37.8 percent. In July 2023, the baseload power previously provided by Indian Point was replaced by additional fossil fuel generation to maintain grid reliability.
These are significant changes to the fuel mix during peak demand. This shift in fuel mix affects the price of electricity, reliability dynamics, and carbon emissions in New York State. While the peaks are the most critical for reliability analysis, it is important to analyze how these changes affect reliability and emissions during other times of the year as well. To this end, we conducted a valley analysis (below) to see how the composition of the fuel mix has changed during times of low demand.
Electricity production from wind and other renewables plateaued during peak months in our data set. Wind power provided less than two percent of all power generated during July 2017 and 2023. The output from wind was only 49 GWh higher in July 2023 than it was in 2017. The fuel category ‘other renewables’ was similarly insignificant and contributed fewer GWh in 2023 than in 2017. These data points reveal a massive flaw in New York State energy policy.
In 2019, the New York State legislature passed the Climate Leadership and Community Protection Act (CLCPA). CLCPA requires 70 percent of all electricity generation in New York to come from renewable energy by 2030. The legislature expected renewables to fill the gaps that were created by the shutdown of the Indian Point reactors, but renewables have not replaced the power generation from Indian Point. The state is working to expand the capacity of renewables on the grid, but the gains have been marginal relative to NYISO’s needs. There is currently no evidence that renewable energy will be able to displace natural gas during peak demand. While these resources may someday make significant contributions to the grid and help to maintain grid reliability, at present, the real replacement for Indian Point’s power has been increased output from natural gas and dual-fuel power plants.
Valley analysis
Although periods of low demand and abundant output pose no risks to families or businesses, a valley analysis of the lowest production months allows us to understand the energy mix during times of low output. This analysis shows how the state’s power needs change throughout the year and how the fuel mix changes to meet demand. We identified the valley months from 2017 to 2023 and analyzed their output in the same manner as we did for the peak analysis. The valley months in our data set were February, April, May, and September.
In April 2017, nuclear power generation was the greatest contributor of electricity to the NYISO grid. Nuclear power plants generated 2,906 GWh, or 31.3 percent of all power generated. Hydroelectric power generated the second-highest proportional output — 2,464 GWh, or 26.5 percent of all power generated. Natural gas power plants provided 1676 GWh, or 18.1 percent of all power on the grid. During the valley months, natural gas’ percentage was lower than its average in our data set. Dual fuel generated 1,624 GWh, or 17.5 percent of all power generated on the grid. Overall, the fuel mix in April 2017 is similar to that of the other valley months in our data set.
In April 2023, nuclear power plants generated 1,819 GWh, or 20.9 percent of all electricity generated on the grid. Following the closure of Indian Point, nuclear power contributed 1,087 GWh less than it had in 2017. Hydroelectric power generation contributed the most electricity of all fuel sources, generating 2,297 GWh, or 26.4 percent of all power generated on the grid. Natural gas power plants generated 1,843 GWh, or 21.2 percent of all electricity on the grid. Dual-fuel power plants generated 2,128 GWh, or 24.4 percent of all electricity on the grid.
The closure of Indian Point forced a significant shift to natural gas and dual-fuel power plants. In April 2017, natural gas and dual fuel made up 35.5 percent of all power generation. In April 2023, natural gas and dual fuel’s share of power generation had risen to 45.6 percent. The output from nuclear power plants dropped from 2,906.32 GWh to 1819.21 GWh. This is a decline of 1,087 GWh, or 37.4 percent over six years. Compared to 2017, dual-fuel power plants generated an additional 504 GWh of electricity to meet demand. Likewise, natural gas power generators generated an additional 167 GWh. Even during periods of low demand, NYISO now uses fossil fuels to generate a larger proportion of its electricity needs.
While ‘other renewables’ played an insignificant role during the valley months, as was the case during the peak months, the output from wind was slightly higher in the valley months. In April 2023, wind power generated 462 GWh, or 5.3 percent of all electricity on the grid. This is nearly double the share of wind power generated during the peak of July 2023. This analysis reveals that the existing wind power produces the most value for NYISO when it is least needed. It makes sense that wind power has low output during the peak summer days, as heat waves often occur in strong and persistent high-pressure systems with lower wind.
During the August and July peaks, wind produced an average of 229 GWh of electricity. During the valley months, it produced an average of 381 GWh. Future developments could change these dynamics. However, in April 2017, wind power generated 403 GWh of electricity; in April 2023, it only generated an additional 59 GWh. This increase is insignificant when compared to the generation from natural gas and dual-fuel power plants.
The loss of Indian Point’s energy production affected the fuel mix more during peak months than during valley months. New York is now more vulnerable to heat waves and other shocks. Those shocks could leave New Yorkers without air conditioning and other critical services when they most need it. While higher peak electricity costs are easy to measure, it is harder to measure the threat these reliability concerns pose to New Yorkers, particularly those who are more vulnerable to high temperatures — people who do not have air conditioning, young children, the elderly, and people suffering from certain health conditions. The shuttering of the reactors at Indian Point will likely result in unnecessary deaths in a heat wave that creates demand beyond the supply on the NYISO grid.
When properly maintained, only nuclear, dual-fuel, and natural gas power plants operate independent of weather conditions. While hydropower provides a low-carbon and predictable amount of power, its output is limited by the flow of available water running through the turbines, which is subject to rainfall and other climate conditions. As more power is required to meet peak demand, dual fuel and natural gas are the sources that can most readily expand their supply and increase their output. Dual-fuel plants will meet a greater proportion of new demand because of their greater ability to increase output. Natural gas power plants remain constrained by the maximum throughput of the pipes that transport the gas to their generators.
The peak and valley analyses provide context for the present state of the NYISO grid. We now analyze how the change in fuel mix affected the price of electricity, grid reliability, and New York’s carbon footprint.
When properly maintained, only nuclear, dual-fuel, and natural gas power plants operate independent of weather conditions. While hydropower provides a low-carbon and predictable amount of power, its output is limited by the flow of available water running through the turbines, which is subject to rainfall and other climate conditions.
Price analysis
Numerous shocks introduced price volatility to New York State’s power market over the past few years. State and federal policy decisions have left New Yorkers vulnerable to winter storms and heat waves. While the NYISO grid is not an integrated utility, the types of power generators and prices on the grid are downstream of policy decisions. For example, the fuel mix is influenced by federal and state regulations, subsidies, and mandates.
To analyze prices on NYISO, we used NYISO’s locational-based marginal price reference bus. This data set provides a reference node—or poin—for pricing on the grid. NYISO selects the reference bus location to help guide its strategic decisions and analysis of the grid, as this location is representative of the pricing dynamics on the broader grid. This node can serve as a proxy for analyzing the changes in marginal pricing in our data set. On the NYISO grid, power generators bid to meet demand every five minutes, and the price varies depending on the location. NYISO provides the top marginal price for each of these five-minute intervals. We used this data to analyze how the marginal price of electricity changed every five minutes from January 1st, 2017, through December 31st, 2023.
In our analysis, we analyzed both the average and median price of electricity on NYISO. Electricity prices can spike to new highs as demand outstrips supply. Electricity prices can even go negative as low demand or transmission issues lead to an excess of electricity in a given area. The median price is more indicative of the marginal costs of electricity over a given time period and reduces the effect of outlier positive and negative values. However, it can be valuable to analyze the averages as well, particularly over a time when prices were highly variable and the marginal cost of electricity was consistently higher than the preceding years.
The median price of electricity in our data set was $24.70 per MWh. In 2020, it was $17.21 per MWh, or 30.3 percent below the median for the data set. These lower prices and the drop in demand made the decision to shutter Indian Point falsely appear inconsequential for short-term electricity prices in New York.
Over one year, many factors influence the median price of electricity. Especially cold winters or particularly hot summers could increase the median price. A global supply shock of natural gas or a collapse in demand could generate significant price volatility. Year-to-year, the mix of power generation on the grid will change due to fuel costs, regulatory actions, and other variables, like the retirement of Indian Point’s reactors.
A mild winter with high precipitation could lead to higher hydroelectric power output and lower, more stable prices. A mild summer could result in greater-than-average wind output and lower peak demand. An analysis of the median price over a few years provides insights into the price trend on the electrical grid and how various shocks have increased the energy costs in New York.
The two greatest years of deviations from the median price in this data set were 2020 and 2022. In 2020, the price of natural gas fell as the COVID-19 pandemic and associated policy responses led to a sharp decline in global demand for energy. Electricity prices in 2020 were uncharacteristically low in NYISO and elsewhere.
However, in 2022, Russia’s invasion of Ukraine and the resulting sanctions caused a supply shock and an energy price spike because Russia is a major producer and exporter of natural gas. In 2022, the median price of electricity on NYISO was $45.39 per MWh. The 2022 shock jolted the median price of New York’s electricity to 83.8 percent higher than the median electricity price for our data set. Earlier decisions by New York policymakers to ban hydraulic fracturing — better known as “fracking” — and to prevent the building of new pipelines to efficiently transport natural gas exacerbated the supply shock. New York’s increased reliance on natural gas for dispatchable power led to higher prices passed onto businesses, families, and other ratepayers.
The 2022 shock jolted the median price of New York’s electricity to 83.8 percent higher than the median electricity price for our data set.
While Russia’s invasion of Ukraine may not have been foreseen by state policymakers, an increased reliance on natural gas and dual-fuel power generation was a predictable consequence of shuttering Indian Point’s reactors. Indian Point’s closure left New Yorkers far more exposed to the volatility of the global natural gas market than they had been before 2022.
Fossil fuel dependency leaves customers vulnerable to price fluctuations. From January 2020 through June 2021, the median price of power on NYISO was lower than the median for our data set. After June 2021, the median price rose to new highs for our data set in late 2021 and in the winter of 2022. Since February 2023, the price has trended down with small oscillations around the median price.
To better represent this volatility, we calculated the standard deviation in median monthly electricity prices from January 1st, 2017 to January 1st, 2020 and from January 1st, 2020 to December 31st, 2023. In the pre-2020 period, the standard deviation of monthly median electricity prices was $5.32 per MWh. In the following period, the standard deviation more than tripled to $16.81 per MWh. Prices were much less predictable in the post-2020 period.
This additional volatility raised costs for ratepayers in NYISO. Location-based marginal pricing is only one component of the costs imposed on ratepayers, but its fluctuations have a direct effect on their electricity costs. Higher price volatility makes it harder for families and individuals to budget. Less predictable utility bills are particularly challenging for seniors and others who live on fixed incomes. High unexpected prices can cause people to forgo other important purchases, including skipping meals or not fulfilling prescription medications. This volatility also makes it more difficult for businesses to plan for the future and limits their ability to grow and hire more employees.
Greater dependence on natural gas led to higher electricity bills for ratepayers in 2022
Natural gas and dual-fuel power plants contributed more power to the grid in 2022 than they would have if Indian Point had stayed online. Consequently, New Yorkers paid more for electricity. But we wanted to know exactly how much that dependence cost the Empire State.
We created a simple model to analyze the additional aggregate electricity costs that New York ratepayers faced due to the closure of Indian Point. To conduct this analysis, we created two counterfactuals in which the reactors remained online in 2022. We did so by making a few simple assumptions:
- Every MWh of power generated by Indian Point would have replaced a MWh of power generated by other power plants.
- A MWh of power generated by Indian Point would have cost ratepayers the price of electricity generated by Indian Point reactors two and three from January 1st, 2017 to December 31st, 2019.
- Indian Point would have continued to operate at 2083 MW, running at 93 percent of operational effectiveness, equal to its average over the preceding decade.
- The alternative price for a MWh of power would have cost ratepayers the average or median price of electricity on NYISO in 2022, using data from the real-time location-based marginal pricing NYISO reference bus node.
Location-based marginal pricing auctions on ISOs present challenges for accurately modeling the impact of a single power plant on the costs paid by ratepayers. Our simplified model estimates the impact of closing Indian Point despite these challenges. A large savings estimated by this model would be a signal that ratepayers would have saved money because the electricity generated by Indian Point would have reduced grid volatility and consistently driven down the single market clearing price. If large savings are nonexistent, then Indian Point would have often bid at too high of a price for its bid to have been accepted or, more likely, bid just below the expected market clearing price to sell its power. This would not have raised the marginal price of electricity but led to sustained losses for Indian Point.
According to our average price model, shutting down Indian Point led to New Yorkers paying an extra $304 million in electricity costs in 2022, all else being equal.
In practice, all of our assumptions would have held in 2022. The cost of electricity generated by Indian Point would have been lower than the cost of electricity generated by a dual-fuel or natural gas plant, due to the higher price of natural gas in 2022. Indian Point also provided a consistent baseload of power, meaning that it reduced demand for power from more expensive peaker plants that only generate power when the market clearing price spikes. The price of power generated by Indian Point had low volatility from 2017 to the beginning of 2020. The costs of nuclear power generation are less volatile because operators can purchase and store uranium for long time periods, reducing their exposure to short-term spikes in fuel costs.
Our simplified model ignores NYISO’s capacity market and that the top marginal bid from power plants sets the market-clearing price at a given location. In practice, if Indian Point had been operational in 2022, it would not have set the market clearing price, and the power plants would have been compensated at the rate set by the bid of a natural gas or dual-fuel peaker plant. Recall that peaker plants are less-efficient power plants that only operate and bid at higher prices as demand rises, like during a winter storm or heat wave.
We downloaded the real-time location-based marginal reference bus pricing data from NYISO, adjusted the prices to 2023 dollars, and calculated the median and average prices of power per MWh in 2022. We did the same with the Indian Point data from 2017 to 2020. From there, we subtracted the Indian Point electricity price from the 2022 electricity price to get the difference. Next, we calculated how many MWh of electricity Indian Point would have generated in 2022 by multiplying Indian Point’s capacity (2,083 MW) by its capacity factor (.93) by the number of hours in a year (8,760). Indian Point would have generated 16,969,784 MWh in 2022. By multiplying the number of MWh Indian Point would have generated by the difference in the costs of electricity we calculated before, we get the aggregate difference in costs if Indian Point had continued to operate, according to the model’s assumptions.
Between 2017 and 2020, the average price of a megawatt-hour of electricity produced by Indian Point was $37.42. In 2022, the real average electricity price per megawatt-hour for NYISO was $55.36 per megawatt-hour. According to our average price model, shutting down Indian Point led to New Yorkers paying an extra $304 million in electricity costs in 2022, all else being equal. This result suggests that ratepayers would have realized significant savings had Indian Point continued to operate and drive down the price of electricity.
Between 2017 and 2020, the median price of a megawatt-hour of electricity generated by Indian Point Reactors was $30.16. In 2022, the real median electricity price per megawatt-hour for NYISO was $45.39 per megawatt-hour. According to our median price model, the decision to shut down Indian Point led to New York families, businesses, and other ratepayers paying an extra $258 million in electricity costs in 2022, all else being equal. The size of this result suggests that ratepayers would have avoided significant costs if operations at Indian Point had continued in 2022.
Market volatility could imply using the median values for this type of analysis would be superior to using average prices, which could skew our results. According to the reference node data, 2022 was the year that had the most outlier high prices of any of the years in our data set by far. In our analysis, we defined outlier high prices as those that were 1.5 times the interquartile range above the third quartile of prices. With this analysis, there were 2,486 outlier high prices in 2022. These accounted for 51.9 percent of all outlier high prices from 2017 to 2023. Therefore, use of the average prices for this analysis is representative of the experience of ratepayers on NYISO in 2022. However, the use of median prices does not make the counterfactual savings insignificant.

While these results are significant and the methodology is easy to understand, they are a reflection of NYISO’s greater dependency on natural gas in 2022. Indian Point could have played a critical role in protecting New Yorkers from large spikes in global natural gas prices. The exact savings are difficult to calculate due to the complexity of NYISO’s auction system, but this model provides a useful approximation. It is clear that the savings would have been meaningful and provided relief to New Yorkers during a painful period of high inflation.
However, in 2023, the electricity market on NYISO was quite different. The price of natural gas plummeted in New York. In general, prices on NYISO were lower and less volatile in 2023. If we use the same methodology and the median electricity price in 2023, we find that ratepayers would have paid an extra $114 million in electricity costs, a negative result — all else being equal. Under our simplified model, bids from Indian Point would have often been above the market clearing price and would not have driven down costs for ratepayers. Indian Point would have needed to lower its bids in order to have them accepted or would have otherwise had a marginal impact on the price of electricity.
If Indian Point had remained online during a period of cheap natural gas, it would not have cost ratepayers a lot more, or maybe more at all. Instead, the losses would have been borne by Entergy. However, during periods of peak demand or high natural gas prices, Indian Point would be both highly profitable and helpful for maintaining reliability. If New York faces a severe heat wave or other significant shock, the residents of New York City will wish that they had access to Indian Point’s power generation. Indian Point provided immense value to NYISO through its reliable, low-carbon electricity and the plant was not adequately compensated for these contributions. The efforts to replace Indian Point’s generation will be more costly, especially when considering the deleterious environmental effects of increased carbon emissions and the increased risk of blackouts during a severe weather event.
Thus far, we have described the change in the composition of fuel sources on NYISO and the costs to New York ratepayers. With this context, we can now analyze additional effects on the grid in the forms of grid reliability and sustainability.
Sustainability and emissions analysis
Governor Andrew Cuomo signed the Climate Leadership and Community Protection Act into law in the summer of 2019. The state’s website describes it as “…among the most ambitious climate laws in the nation and requires New York to reduce economy-wide greenhouse gas emissions 40 percent by 2030 and no less than 85 percent by 2050 from 1990 levels.” This is an ambitious plan, especially because of the higher demand from electric vehicles and heat pumps.
It is clear that NYISO’s dependence on fossil fuels — particularly natural gas — has increased since 2017. In 2017, natural gas generated 39 percent of all electricity on NYISO. In 2023, it generated 50 percent. For our carbon emissions analysis, we assumed that dual-fuel power plants are running on natural gas. For the most part, this is a charitable assumption as natural gas power plants — particularly those that are combined cycle — have the lowest emissions per unit of power of any fossil fuel generator.
In 2017, NYISO generated 130,251 GWh, and 39.5 percent of that power came from either natural gas or dual-fuel power generators. By 2022, the NYISO grid generated 130,032 GWh of electricity, but 51.9 percent of that power came from either natural gas or dual-fuel power generators. According to the ambitious New York State net-zero plan, fossil fuel use should have been receding, not increasing. Since 2019, however, the total electricity generated by power plants not powered by natural gas has fallen by nearly 20,000 GWh per year. If Indian Point reactors two and three had continued operations, they would have generated 16,969 GWh per year, or nearly 83 percent of the difference.
To directly calculate the change in emissions from electricity generation on NYISO, we first converted the GWh generated each year to kilowatt-hours (kWh) generated each year. We then multiplied the kWh by the median life-cycle emissions, as measured in grams of CO2 per kWh. Life-cycle emissions consider the emissions involved in the creation, transportation, operation, and disposal of a power generator. We converted grams of CO2 to megatons (Mt) generated by each fuel category on NYISO. Each megaton is the equivalent of a trillion grams, or one million metric tons.
We used the median life-cycle emissions estimated by the National Renewable Energy Laboratory. According to their data, nuclear power generates 13g CO2 per kWh; wind generates 13g of CO2 per kWh; hydro generates 21g CO2 per kWh; and natural gas generates 486g CO2 per kWh.
For the purposes of this analysis, we have assumed that all power generated by dual-fuel power plants came from natural gas. For emissions analysis, this may understate the total emissions generated for electricity production on NYISO — although the specific life-cycle emissions per kilowatt-hour can vary significantly from plant to plant. Hydro, natural gas, nuclear, and wind generate close to 95 percent of all electricity on NYISO. The other sources are marginal and difficult to approximate, so we have excluded them from our analysis. This analysis should give clear insights into how the changing fuel mix on NYISO has affected New York State’s progress towards its sustainability goals.
The life-cycle megatons of carbon emissions generated has risen since 2017, with a new high in 2022 for our data set. This new high is despite there having been only 220 GWh of additional electricity generated in 2017 relative to 2022. For this data set, the greatest amount of electricity was generated on NYISO in 2018. However, that generation resulted in 28.54 Mt of CO2 emissions, which is 15.5 percent less than the 33.78 Mt of CO2 emissions in 2022.
Indian Point counterfactual
How much lower would emissions have been if Indian Point had been online in 2022?
For this analysis, we assume that every MWh of power generated by Indian Point would have replaced a MWh of power generated by natural gas and that Indian Point would have continued to operate with a .93 capacity factor of its 2,083 MW of output.
Similar to our price analysis, we first calculated the total kWh that Indian Point would have generated. We multiplied Indian Point’s capacity (2,083 MW) by its pre-closure capacity factor (.93) by the number of hours in a year (8,760) to get the total number of megawatt-hours generated: 16,969,784.4 MWh. We then multiplied this number by 1,000 to convert into kWh so we can use our grams of life-cycle CO2 per kWh conversion rates: 16,969,784,400 kWh. Next, we multiplied this output by the difference between the conversion rates of natural gas (486 g/kWh) and nuclear (13 g/kWh), or 473 grams of CO2 per kilowatt-hour. The result is 8,026,708,000,000 grams of CO2, or 8.03 metric megatons. In one year, Indian Point would have reduced the emissions impact of New York by 8.03 metric megatons of CO2. To put this number in context, the entire country of Costa Rica — population 5.2 million — generated 7.9 metric megatons of CO2 emissions in 2022. Eight metric megatons is also more than three times the carbon emissions of Washington, D.C. in 2021.
In 2022, power generators on NYISO were responsible for the generation of 33.78 Mt of life-cycle CO2 emissions. In our counterfactual, these power generators instead generated 25.75 Mt. If Indian Point had remained online, emissions generated would have been at least 23.8 percent lower for all of NYISO in 2022.
Without Indian Point, New York State will have difficulty reaching its decarbonization goals. Even if it does reach those targets, New York will have emitted dozens or even hundreds of additional megatons of carbon than it otherwise would have.
As shown in the graph above, natural gas power generation still makes up the vast majority of all emissions on NYISO. In the counterfactual, natural gas generates 39.6 percent of the electricity and 95.3 percent of all emissions. In the actual emissions data from 2022, natural gas generated 52.9 percent of all electricity and 97 percent of all emissions. In the counterfactual, Indian Point generates 13.3 percent of all electricity and only 0.9 percent of all emissions. In 2017, NYISO generated a comparable amount of electricity as it did in 2022 but only had 26.17 Mt of CO2 emissions. This is particularly important in the context of downstate New York’s contributions to NYISO’s aggregate emissions.
In western and upstate New York, fossil fuels generated only seven percent of all electricity in 2022. In contrast, they were responsible for over 95 percent of electricity downstate.
With NYISO’s breakdown of regional energy production, the broader fuel mix and emissions data can be seen in a new light: upstate New York has more or less already decarbonized, at least in the context of existing demand. Downstate New York, on the other hand, took a big step backward with the closure of Indian Point. Downstate does not have the same access to hydroelectric power as the rest of New York. Committed investments in nuclear and hydroelectric power decades ago allowed upstate New York to decarbonize before that was even the intended policy aim.
The hydroelectric Robert Moses Niagara Power Plant, outside of Buffalo, began operations in 1961. It took only four years to build the 2,525 MW plant. The first of the reactors at the Nine Mile Point and James A. Patrick nuclear power plants outside of Oswego were built and commissioned in the late 60s and early 70s for a combined capacity of 1,457 MW. The second reactor at Nine Mile Point was built from 1975 to 1988 and has a capacity of 1,375 MW. Similarly, the 580 MW Ginna nuclear power plant, 20 miles outside of Rochester, was built in the late sixties. These large projects and other hydroelectric plants produce nearly 84 percent of all of upstate New York’s electricity.
At present, the downstate decarbonization plan is to build transmission capacity to import low-carbon power that was generated elsewhere, including upstate, neighboring states, and Canada. But building large amounts of transmission lines is expensive and all projects will be subject to an array of lawsuits — particularly given current state and federal permitting regulations. The bureaucratic requirements for permits to build large infrastructure projects have grown significantly over the past few decades, reducing investment in and raising the costs of new critical infrastructure projects. However, downstate is also constrained by the space needed to produce power. This is particularly an issue for solar and wind power. Wind and solar power have a lower energy density than other power generators — they produce a small amount of power relative to their footprint. The entire Indian Point Energy Center sat on only 239 acres, less than a square mile in size. Yet the combined capacity of both reactors was 2,083 MW. Per unit of power generated, nuclear power plants require 1/77th the amount of land as photovoltaic solar, 1/197th the amount of land as offshore wind, and 1/352 as much land as onshore wind.
The path to decarbonizing downstate and reaching New York’s ambitious climate goals will require regulatory reform at the state and federal levels. New York needs to build more energy infrastructure to meet future demand and ensure reliability. Under the status quo, these critical projects will take longer and cost more than is necessary, raising the price of electricity for ratepayers.
Reliability
In practice, the only sustainable grid is a reliable one. Families and businesses expect their power will be there when they need it and do not want to be surprised by a budget-busting bill at the end of the month. If NYISO cannot maintain the equilibrium between supply and demand, then its ratepayers will not be happy with their service or their state’s leadership. For the transition to a lower carbon grid to be politically sustainable, reliability is essential and new low-carbon power plants need to deliver the same, or greater, value to the grid as the ones they’re replacing.
Germany’s “green” transition
Germany provides an example of a “green” transition that failed to deliver for its ratepayers. Germany pursued renewables and natural gas to meet their power needs and shut down their nuclear plants. Germany’s leaders continued to shut down their nuclear plants even after Russia’s invasion of Ukraine, the subsequent sanctions against Russia, and the sabotage of their Nord Stream 2 pipeline that brought natural gas from Russia to Germany. Instead of keeping their nuclear plants online, German leadership decided to restart their old coal plants to keep the lights on, despite pleas from climate scientists. From January 2023 to January 2024, 27.5 percent of the electricity produced in Germany came from coal plants.
Despite Germany’s decision to turn the coal plants back on, several energy-intensive industrial companies have gone insolvent or moved production abroad in pursuit of more reliable and affordable power. Automobile manufacturers and suppliers have cut production by five percent, and 22 percent of carmakers say they plan to shift investment abroad. Hakle, a German toilet paper manufacturer, declared insolvency. Chemical giants BASF and Yara International cut ammonia production by 65 percent, a key ingredient in fertilizer. To mitigate further damage, the German government approved 12 billion euros in subsidies for businesses in 2024.
As companies invest elsewhere and reduce capacity, Germany loses comparative advantages in critical sectors. Skilled workers have retired, sought new opportunities elsewhere, or otherwise moved on. These decisions have caused irreversible damage to Germany’s industrial base and increased their emissions.
Nuclear and hydroelectric power decrease the carbon intensity of the grid while ensuring reliability. Unlike wind and solar power plants, nuclear and hydroelectric power plants provide power all day long with little day-to-day volatility in output. Their consistent output makes it easier for the grid to balance supply and demand to maintain reliability. When a greater proportion of a grid’s electricity mix comes from intermittent sources, it becomes more difficult to balance the grid. Demand is always variable due to the changing needs of ratepayers on the grid. A drop in temperature in one region can lead to a spike in demand as household heaters work to control the temperature of homes. A nuclear plant produces a reliable and consistent output of power that makes it easier for NYISO to respond to these shifts in demand. Whereas intermittent renewables add volatility beause their output is also variable. The drop in temperature could be coupled with a sudden drop in output from solar panels or wind turbines. NYISO must ensure there are sufficient dispatchable sources of electricity to fill any unanticipated gaps in supply. Advocates for a shift to more intermittent power generators believe that these gaps in output will be filled by electricity from batteries or pumped hydroelectric power. Batteries and pumped hydroelectric power store electricity to be used at a later time. In practice, these gaps have been overwhelmingly filled by natural gas, as these plants can ramp up production to help maintain reliability.
Germany pursued renewables and natural gas to meet their power needs and shut down their nuclear plants. ….Instead of keeping their nuclear plants online, German leadership decided to restart their old coal plants to keep the lights on, despite pleas from climate scientists.
Renewables in California and Texas
When looking for domestic comparisons, it is most helpful to look at California Independent System Operator (CAISO) and the Electric Reliability Council of Texas (ERCOT). Both of these grid regions operate similarly to NYISO and provide the bulk of electricity to their respective states. In both CAISO and ERCOT, a greater proportion of electricity is generated by wind and solar than in NYISO. From January 2023 to January 2024, 34 percent of ERCOT’s and 26 percent of CAISO’s electricity production came from wind and solar. Only 5.6 percent of power generated on NYISO came from intermittent renewables. However, NYISO had a much lower carbon intensity per kWh than ERCOT and a carbon intensity that was only marginally greater than CAISO.
Why was NYISO’s carbon intensity comparably low despite renewables only generating 5.6 percent of all electricity on the grid? The answer is upstate New York’s nuclear and hydroelectric power plants.
If New York pursues a strategy of decarbonization that involves shuttering upstate New York’s nuclear power plants, the carbon intensity on NYISO will rise, as it did after Indian Point’s closure, even if NYISO is able to generate significant power from renewables. To ensure reliability, New York would need significant investment in new natural gas power plants and grid-scale batteries to balance the volatility of new renewables. CAISO is a case study as to what investments are required to scale intermittent renewables in a grid region.
Electricity production from solar plants is volatile over the course of a day. Solar plants in California are reliably productive during the day and reliably offline after the sun sets. Even with a significant investment in batteries, natural gas is still essential to meet the electricity demand of California’s ratepayers in the evening. Batteries charge during peak sunlight hours and discharge in the evening as prices rise, as the zero marginal cost solar plants go offline and other power generators compete for higher revenues.
This is what a typical January day looks like on CAISO:
The graph above shows the volatility of output over the course of a day on CAISO. Natural gas is essential to meet demand all day long, with a consistent dip during peak sunlight and a corresponding increase as the sun sets. Batteries charge during peak sun and then discharge most of their power as the sun sets and prices rise. Nuclear power provides a consistent baseload all day. Hydroelectric power is stored by pumping it to a higher elevation during peak solar output and then the hydroelectric plants ramp up their production in the early evening.
In 2022, California Governor Gavin Newsom proposed extending the operations of the state’s sole remaining nuclear power plant, Diablo Canyon. Governor Newsom had previously called for the plant’s closure. A combination of appeals by climate scientists and activists and rising reliability issues convinced the governor to extend its operations. Even with the reversal, California still faces the threat of rolling blackouts during a heat wave.
In any event, CAISO should not be a role model for NYISO. The average price of electricity on CAISO is higher than it is on NYISO. On average, a California resident paid over 29 cents per kilowatt-hour in January 2024, up from roughly 26 and a half cents the year before. A New York resident paid a little more than 23 cents per kilowatt-hour in January 2024 and prices had fallen from the year before. CAISO has some of the highest electricity prices in the United States despite their relative abundance of zero marginal cost of solar power. While New York’s electricity costs are still some of the highest in the country, they are meaningfully cheaper than California’s. Solar projects in New York would need to be much cheaper than in California to be economically viable, and to do so with far fewer sunny days per year. California has one of the most favorable geographies for solar, while New York has one of the worst. The efficiency of the best solar in California is at least 1.5 times greater than the best solar would be in New York.
California suffered rolling blackouts during a heatwave in 2020. In September 2022, California narrowly avoided additional blackouts during a 10-day heatwave. In summer 2023, CAISO was better prepared for high temperatures due to investments in battery storage and higher output from their hydroelectric plants, due to high precipitation during the winter. California still has significant reliability challenges but they have been mitigated by the continued operations of Diablo Canyon nuclear power plant.
While New York’s electricity costs are still some of the highest in the country, they are meaningfully cheaper than California’s. Solar projects in New York would need to be much cheaper than in California to be economically viable, and to do so with far fewer sunny days per year.
New York must reject all policies that will further reduce NYISO’s reliability. The examples of Germany and California underscore the ways in which a transition to a lower carbon electricity grid can go astray. CAISO has higher prices, greater reliability issues, and only marginally lower carbon emissions than NYISO. While NYISO is doing better than CAISO, New York City has its own projected reliability concerns that present a real threat to the safety and well-being of all New Yorkers.
New York City is not prepared for a prolonged heat wave
At present, the greatest reliability concerns on NYISO are in New York City. According to NYISO’s second quarter short term reliability report in 2023 (2023 Q2), New York City is not prepared for a serious heat wave. As our analysis shows above, demand for electricity peaks in the summer as New Yorkers seek refuge from dangerous temperatures by turning on their air conditioners.
The Transmission Security Margin (TSM) is the amount of transmission capacity reserved to ensure reliable operation of the power grid. Projections of a large positive TSM mean that families need not be concerned about rolling blackouts or turning the air conditioning down during a heat wave to avoid an unaffordable electric bill. A projected negative TSM should concern every resident in New York City for the same reasons.
Under NYISO’s assumptions in the 2023 Q2 report, electricity shortfalls will occur during a 98 degree heat wave. The peak temperature in New York City in 2023 was 93 degrees. However, the peak temperature a year earlier was 97 degrees. With the projected energy shortfall in 2025, it’s possible that even a 97 degree day could leave New Yorkers unnecessarily vulnerable to extreme heat.
Peak Temperature in Central Park, New York City from 2010 to 2023:
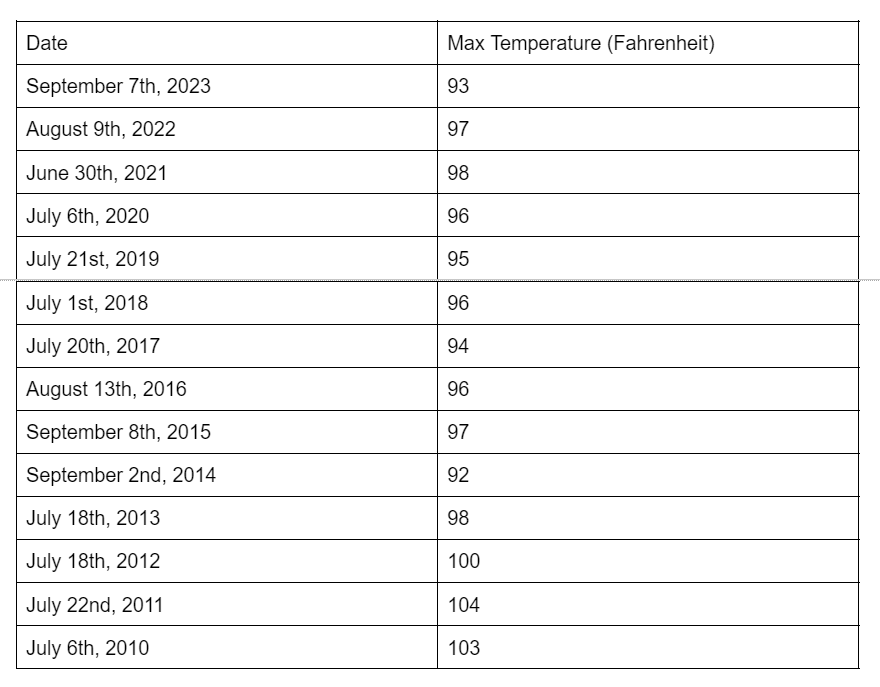
Since 2010, there have been seven years with a peak temperature at or above 97 degrees. During the same time period, the peak temperature rose above 102 degrees twice. In 2011 and 2010, the peak temperature rose above 100 degrees on two consecutive days. Days above 97 degrees may not happen every year but they do happen. New York City could be vulnerable to extreme heat if the electrical grid is unable to meet demand.
With the existing generators and transmission, the risks from a 102-degree heat wave are even more serious. In the 2023 Q2 model, there is no year in the coming decade where New York City will be ready for a 102-degree heat wave. During the 2011 heat wave, ConEd was able to avoid rolling blackouts. According to a report created by the New York City government, in 2011, there were 33 deaths directly caused by heat-stress and over 300 heat-exacerbated deaths, where excessive heat aggravated a pre-existing condition. The same report revealed that from 2011 to 2020, the people who died during heat waves in New York City were more likely to be poor, older, black, or suffer from one or more chronic conditions. They either did not have air conditioning or it was not working. A reliable grid is critical to public health and it is an abdication of responsibility to leave all New Yorkers under threat from a serious heat wave.
Since the publication of NYISO’s 2023 Q2 report, New York State regulators extended the operations of select peaker plants to make up for the projected 446 MW shortfall. However, the described risks still remain for temperatures above 98 degrees. Even the estimates in the graph above for 2026 and beyond are contingent on the timely completion of the Champlain Hudson Power Express (CHPE), a large transmission project to bring hydroelectric power from Quebec to New York City. State-level leadership must ensure that nothing prevents the CHPE project from meeting the assumptions in NYISO’s models. And even with CHPE, the margins are thin or nonexistent.
New York’s policymakers must take decisive action to prepare for the possibility of a deadly heat wave. Furthermore, they must advance an energy policy and strategy that will not leave New Yorkers vulnerable to a severe heat wave for the next decade. Policies that would further reduce New York City’s total security margin must be abandoned in favor of efforts to improve reliability. In the short-run, efficiency improvements can help to reduce the need for power, particularly targeted interventions that reduce demand during heat waves. In the longer run, New York City will need access to additional power generation and transmission. State and federal-level permitting reform will be critical to resolving this issue while maintaining affordability.
New York City will face a 102-degree heat wave at some point in the future. These issues need to be resolved before then. New York City’s pending summer reliability crisis is the result of avoidable decisions by political leaders and the closure of Indian Point.
Winter Storm Elliott and the potential for catastrophic failure
In late December 2022, much of the United States experienced Winter Storm Elliott, a massive system of blizzards, high winds, snowfall, and record cold temperatures. Buffalo’s airport had to shut down for five days and local officials banned their constituents from driving due to zero visibility and the risk that they would be snowed into their cars. Airlines canceled tens of thousands of flights, leaving holiday travelers stranded throughout the United States.
The broader NYISO system did not face significant problems relative to other electrical grids. Demand for electricity was high, but there was plenty of supply to meet it. Local transmission problems posed the greatest threats, as powerful winds damaged trees and knocked out power lines. There were over 100,000 power outages on NYISO during the storm. New York City, however, was unprepared for Elliot.
The near-catastrophic failure in New York City was not a failure of electricity transmission, but the distribution of natural gas. The freezing temperatures in Manhattan, The Bronx, Queens, and Westchester spiked energy demand. At the same time, the flow of natural gas into ConEd’s distribution system declined due to operational issues caused by the storm. This resulted in a significant reduction in pressure in New York City’s local natural gas distribution system. ConEd was able to return the pressure to normal by converting liquified natural gas into gas through one of its specialized facilities and initiating other emergency procedures. If ConEd had been unable to restore and maintain adequate pressure, the system would have faced outages that would have affected over a million customers. These families would have been left without heat during a severe winter storm in the middle of the Christmas season. Many customers may have needed to evacuate if they couldn’t stay warm and prevent their pipes from freezing and bursting. The storm could easily have been a humanitarian disaster to rival Texas’s near total electrical grid failure during Winter Storm Uri in 2022.
The Federal Energy Regulatory Commission (FERC) and the North American Electric Reliability Corporation (NERC)’s joint report shows that the natural gas issue almost became a multi-month disaster:
“…Had Con Edison not activated its LNG facility and taken its other emergency measures, or had the cold weather lasted longer, it could have faced large-scale outages. System outages for a local natural gas distribution company generally take longer to restore than firm load shed, or even cascading outages on the electric grid. By contrast, for the natural gas local distribution system to return system outages to normal operation, workers must go house-to-house and individually light every pilot light. Con Edison estimated it would have taken months to restore service, even with mutual assistance from other utilities, had it experienced a complete loss of its system.”
While the natural gas supply was distinct from the issues with the electrical grid, it sheds further light on New York City’s overdependence on natural gas. It is more efficient to heat homes with natural gas directly than it is to use natural gas to generate electricity to heat the same homes. New Yorkers heating their homes with natural gas is effective and affordable. However, it is clear that the residents of New York City are dependent on natural gas to protect them from adverse weather events, both extreme heat and cold. New York State policymakers should recognize this vulnerability and the risks posed by undermining this critical infrastructure, especially without a superior alternative. NERC and FERC made numerous recommendations to help mitigate future issues.
While Winter Storm Elliott did not cause significant issues for the electrical grid in New York, it did cause significant issues on surrounding power grids. The interconnection between these grids can play a critical role when one of the electrical grids faces a spike in demand, or a loss of output from more weather-sensitive generators.
Imports can also help to reduce electricity costs for ratepayers. For example, in 2021, New York imported over 45,000 GWh of electricity from Canada and neighboring states. However, the size and severity of Winter Storm Elliott raises reliability concerns about over-dependence on imports. If neighboring grids face a significant change in their fuel mix and simultaneously experience a greater demand for energy, there may not be enough energy available in an emergency. These risks become more severe as a greater proportion of imports come from intermittent renewables.
Imagine a prolonged summer heat wave that affects much of the East Coast, as happened in 2010. If NYISO and its neighboring grids all rely on wind production for a significant proportion of their electricity, they could all face a significant decline in output at the same time. They may all need to rely simultaneously on natural gas and any backup electricity to balance their own grid and compensate for the drop in wind output. If they had assumed they would be able to import electricity to meet demand during a summer heat wave, that assumption may leave their people vulnerable to dangerous, life-threatening temperatures.
The staff at the ISOs and utilities that create these estimates are great at their jobs. They model many scenarios and work to communicate with one another. Furthermore, NERC, other government entities, watchdogs, and independent analysts also model these scenarios. The risk is when these embedded vulnerabilities are not effectively communicated to lawmakers. Or that the increased complexity of a more volatile grid system makes it more vulnerable to naive top-down policies. There have been a number of close calls over the past few years, like the scenario with Winter Storm Elliott, that highlight that the electrical grid and energy policy must be stewarded with particular care towards maintaining reliability and affordability. NERC’s Reliability Issues Steering Committee highlighted this when they added a revealing new section to their 2023 reliability risk priorities report: “Risk Profile 1. Energy Policy.” Energy policy itself has become a threat to grid reliability.
Policy recommendations
- Keep existing nuclear power plants online. State and federal policymakers should take deliberate action to ensure the continued operations of all existing nuclear power plants, in coordination with the Nuclear Regulatory Commission. These reactors are critical for grid reliability and provide an abundance of low carbon baseload power. The closure of any existing nuclear power plants will derail any attempts to decarbonize the electrical grid.
- Streamline processes to approve new reactor designs. Congress should pass regulatory reforms to ensure that new reactor designs can be approved in a timely and efficient manner. Nuclear power plants play a critical role on the electrical grid and the stagnation of the American nuclear industry since the establishment of the NRC in 1974 is a clear policy failure.
- Remove barriers to building new energy infrastructure and secure critical supply chains. Congress should pass the regulatory reforms in HR1, The Lower Energy Costs Act. The LECA will remove unnecessary red tape to building critical energy infrastructure, secure access to critical minerals required for cutting-edge technologies, and lower the price of electricity for ratepayers throughout the United States.
- Abandon policy proposals that will further undermine grid reliability and pursue energy policy that prioritizes reliability and affordability. New York State policymakers must pursue policy actions that will ensure ratepayers have access to an abundance of reliable power. The current state of NYISO leaves New Yorkers unnecessarily vulnerable to severe weather events and a spike in natural gas prices.
- Mitigate potential harm from rolling blackouts during a summer heatwave. There is a threat of rolling blackouts that would place the residents of New York City in serious danger this summer. In the short run, lawmakers should invest in energy efficiency programs that will effectively reduce demand during a heatwave. In the long-run, New York will need policies that will expand the supply of electricity generated on NYISO.
- Ensure the timely completion of the Champlain Hudson Power Express. The CHPE will be critical to reliability during peak demand in New York City for the coming years. New York’s leadership should actively monitor the progress of the CHPE and proactively remove any unnecessary regulatory barriers that may prevent its timely completion.
- Study the negative externalities of the Inflation Reduction Act on grid reliability. The Inflation Reduction Act appropriated an immense amount of subsidies for electric vehicles and intermittent renewables. These subsidies may have the unintended effects of spurring a rapid increase in peak demand for electricity and crowding out investment in more reliable power generators, respectively. Congress and the Federal Energy Regulatory Commission should analyze the effects of the subsidies in the Inflation Reduction Act on reliability throughout the United States, with a particular focus on deregulated energy markets, like NYISO.
Conclusion
The shuttering of Indian Point significantly changed the electrical grid in New York State. Indian Point’s electricity output was replaced almost entirely by natural gas plants. Over 61 percent of all electricity generated on NYISO in July 2023 came from natural gas and dual-fuel power plants, a significant increase since the closure. This change in electricity mix has been particularly stark for New York City, as Indian Point made up nearly half of its low-carbon electricity generation.
Ratepayers have felt the financial effects of NYISO’s greater dependence on natural gas. In 2022, the price of natural gas spiked due to Russia’s invasion of Ukraine. The natural gas price spike led to a corresponding spike in marginal electricity prices. According to our simplified model, New Yorkers would have saved between $250 to $300 million in electricity costs if Indian Point had continued operations into 2022. On the other hand, New Yorkers would not have found significant savings from the continued operations of Indian Point in 2023, as the price of natural gas dropped to the lowest it has been in many years. However, Indian Point likely would not have cost ratepayers any more money, as it would have needed to bid at a competitive price to even generate revenue. Nevertheless, New York’s increased dependency on natural gas has left ratepayers vulnerable to the volatility of the global energy markets.
The closure of Indian Point has and will continue to have a significant impact on New York State’s carbon emissions. While upstate New York has mostly decarbonized, relying on hydroelectric and nuclear power, over 95 percent of downstate’s electricity generation comes from natural gas. In our emissions counterfactual, we calculated that NYISO would have generated 8.03 fewer megatons of— or 24 percent less — CO2 emissions in 2022 if Indian Point had continued to operate. It will be extremely challenging for downstate to effectively decarbonize and maintain affordability and reliability, particularly without state and federal permitting and regulatory reform. Even when, or if, New York reaches its decarbonization goals it will have generated dozens or hundreds of additional megatons of carbon than it would have if Indian Point had continued to operate.
New York City faces imminent summer reliability concerns. Reports from NYISO have projected that New York City already has insufficient electricity to meet the demands of a severe heat wave. In the short run, New York City needs to invest in effective interventions that will reduce aggregate power demand by improving efficiency. In the longer run, New York City must expand its electricity supply, or the residents of New York City will be left vulnerable to any heat wave with temperatures of 98 degrees or higher. Without sufficient action to ensure reliability, it is a question of when—not if—a catastrophe will happen. If lawmakers in New York are unable to ensure reliability or significantly reduce peak demand, they should seek other strategies to minimize the tragic losses and suffering that will occur during the next prolonged heat wave. Legislators should warn their constituents about this risk and offer suggestions for how they can protect their loved ones, particularly the most vulnerable.
New York City’s local gas distribution system almost failed during Winter Storm Elliott in December 2022. ConEd prevented this failure by deploying stored liquified natural gas and initiating other emergency processes to restore their natural gas distribution system to operational pressure. While this is distinct from the electrical grid reliability concerns that followed the closure of Indian Point, it nevertheless emphasizes New York City’s dangerous reliance on natural gas. Natural gas not only plays a critical role in electricity generation, but in home heating. Without adequate infrastructure to meet these demands, the residents of New York City are at risk. Lawmakers should recognize the importance of natural gas in New York and pursue policies that will make natural gas more affordable and reliable, not policies that undermine critical energy infrastructure. If New York is serious about transitioning away from natural gas, it will need to develop an energy strategy that will ensure affordability and reliability.
Throughout the United States, localities dependent on natural gas suffered high electricity prices in 2022. California, Texas, New York, New England, and states throughout the Midwest face reliability threats due to insufficient reliable and affordable baseload power. They may not have the supply necessary to keep the lights on during a heatwave or a severe winter storm, let alone the capacity necessary to benefit from the projected rapid growth in electricity demand. Americans in every state live in the counterfactual where their own ‘Indian Point’ was never built.
Since the creation of the Nuclear Regulatory Commission in 1974 nearly fifty years ago, only two reactors have been approved, built, and began operations. Without significant regulatory reforms, Americans will continue to live in this counterfactual. At present, the United States is suffering from self-inflicted problems: energy scarcity, persistent reliability threats, higher emissions, lower growth, and insufficient tax revenues. However, it’s not hard to imagine a better, high-energy future. There is great potential to build new nuclear reactors to address these issues and create a future of energy abundance and broad-based material prosperity. Engineers and entrepreneurs throughout the United States are ready to scale-up production of new reactors and liberate America from the challenges of energy scarcity.
 ">
">