



Introduction — by Akash Chougule
From Washington, D.C. to our state capitols, “affordability” has become the word of the moment, invoked by both parties as the problem they alone can solve. Rent and mortgages eat a bigger share of our paychecks than they did just a few years ago. A trip to the emergency room can wipe out a family’s savings. Filling up the gas tank, paying for child care, and putting food on the table cost more than they should. Americans feel this squeeze not in the abstract, but as a pressing issue they face every day.
But too often, voters and policymakers look to the lever of “more government” as the solution, as if the cost of living were a dial that Washington could simply turn and yield the desired result.
Though a tempting response, it is the wrong one. More than simply being ineffective, more government harmfully increases costs, burdening those who can least afford high costs: low-income Americans. Similarly, treating the economy as a fixed pie in which the only way to make life more affordable for some Americans is to take from others is a flawed approach that ultimately does nothing to tackle the root causes of high prices.
These impulses, whether on the left or the right, share a common flaw: it treats high prices as the disease rather than the symptom. The disease is actually bad policies that drive prices up. Today’s cost of living has outpaced the ability of ordinary families to keep up, and as our national debt soars, government-centric policies have only compounded the problem.
Rents are high because we have not built enough homes. Energy costs are volatile because permitting and regulation have throttled supply. Health care is expensive because layers of subsidy and consolidation have dulled competition rather than sharpening it. Trade barriers, deficit spending, and price controls increase prices for everyday Americans and run up the bill for our kids and grandkids. Each of the “more government” solutions now in vogue treats the American family as a passive recipient of whatever Washington decides to dispense. Give them a check, a cap, a mandate, and call it relief, even if it actually increases prices. Just have the government DO something!
That is not how affordability is achieved. It’s achieved through removing government-imposed barriers that allow for more market competition, innovation, and abundance.
Our leaders should instead ask: What would it take for more Americans to build wealth and get ahead under their own power, rather than look to government for relief? The answer is rarely more government intervention.
FREOPP’s approach is unapologetically market-oriented, but it is not indifferent to the real, everyday pain families are feeling. It is precisely because we take that pain seriously that we reject “solutions” built for headlines rather than results. Building more homes; ensuring quality, affordable child care and education; opening markets to competition and trade, modernizing energy policy around abundance and reliability; and getting the country’s fiscal situation under control are not slogans – they are the policies proven repeatedly to bend cost curves down for ordinary families rather than simply reshuffling who bears the burden.
Here’s how we’d do it:
The cost of child care has quadrupled since 1990, and the reflexive “fix” of subsidization often traps low-income families in benefit cliffs that punish them for earning more. Affordability comes by cutting the regulatory burdens that drive up prices, closing benefit cliffs that discourage work, and giving parents real choice over the kind of care that fits their family.
Housing affordability starts by clearing away the zoning rules, building codes, and permitting delays that have made it illegal or impossible to build enough homes, not by capping rents or subsidizing demand into an already-constrained supply.
We make energy affordable by streamlining permitting, which would make new supply available quickly, unleashing nuclear power, and ensuring the costs of new demand are borne by those who create it, not socialized onto ratepayers.
The crisis surrounding health care affordability can be remedied by making pricing transparent, breaking up consolidated markets, and letting patients drive decisions about their own care.
We improve trade and cost-of-living by rolling back tariffs, which function as a tax on American families, rather than pretending they are a free lunch paid for by foreign exporters.
Our national debt is now larger than our entire economy, which drives up interest rates, fueling inflation and crowding out the very programs meant to help the poor. Responsible budgeting is crucial to ensuring long-term affordability.
We make higher education affordable by tying aid and loan limits to real return on investment and making institutions share in the risk—so colleges, not just students and taxpayers, bear the cost of programs that do not pay off.
The enclosed is meant to serve as a resource for policymakers, agency leaders, and advocates who want to move past the theater of cheap populism and class warfare, and toward free-market policies that are proven to work. This handbook notably does not include an endless array of issues; rather, it is tightly focused on the small number of issues that matter most to families’ ability to achieve the American Dream—the core economic necessities of life.
Each policy area can stand on its own as a briefing on a single issue, but together they make a single argument: the affordability crisis is not a problem government solves by turning dials. It comes from ensuring Americans are free to build, compete, and innovate, which leads, among other things, to more goods at lower prices.
In freedom,
Akash Chougule
President, FREOPP
A Better Child-Care Deal for Working Families
by Les Ford
Policymakers should:
- Lower the cost of child care and make it more available to working families by amending regulations that unnecessarily raise prices and ensure reimbursement rates reflect actual costs.
- Give parents greater choice and protect taxpayer funds by making child care assistance neutral among centers, home-based providers, and other lawful care arrangements, while strengthening eligibility, work verification, and payment integrity.
- Eliminate benefit cliffs by replacing abrupt subsidy cutoffs with phasedowns that allow parents to earn more and advance economically without suddenly losing the child care assistance that makes employment possible.
Introduction
Child care prices are one of the greatest impediments to flourishing for young families. Since 1990, the cost of child care has nearly quadrupled, far surpassing increases in wages or household necessities like food, health care, and housing. Over three quarters of American families spend 10 percent or more of their household income on care. But low-income families feel the pricing pressure even more. In 31 states, the child care price-to-income ratio for low-income working parents exceeds 30 percent of their income. Compounding this, assistance for these families is limited and high costs have created long wait lists.
The all-too-common government response to high child care prices is more spending. This spending most often doesn’t address the core issue of why prices continue to rise far too fast. Instead, higher government subsidies inflate the cost of care for all families. Better policies can address the core problems low-income families face.
Regulation is a top driver of child care costs. Policymakers at every level can reform avoidable regulatory costs without compromising genuine safety standards to make child care more affordable. States can also lower child care prices with oversight that makes sure assistance finds its intended purpose.
Child care assistance has some of the most severe state-set “benefit cliffs.” Benefit cliffs occur when a modest increase in household earnings causes a family to lose subsidies, sometimes worth thousands of dollars, leaving families financially worse off for working more or accepting a raise.
On top of rising costs and benefit cliffs, low-income working families don’t have access to the child care that fits their needs. Despite half of parents saying they prefer informal child care arrangements to formal care, even if the latter is free and conveniently located, states prioritize subsidized center-based care. Reform should prioritize flexibility and self-direction for all families.
Smarter decisions can make a difference. Policymakers can lower child care prices, extend current assistance to more working families, address benefit cliffs, and open the flexibility families need all in a fiscally responsible manner. Federal and state regulators alike have both the authority and the obligation to act so working parents can find safe, reliable, and affordable care.
Federal Child Care Assistance Programs
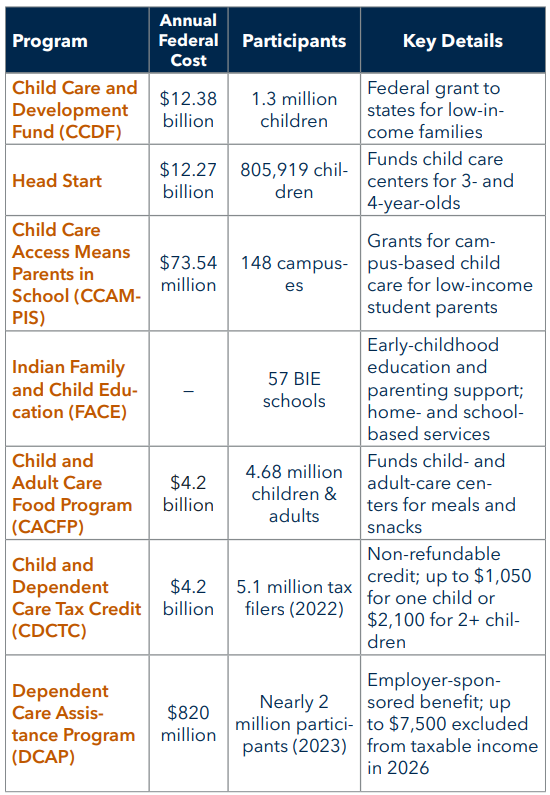
Before diving into reform, it’s important to assess the number and size of federal child care programs. The largest assistance program is the Child Care and Development Fund (CCDF). This sends federal dollars to states to create child care subsidies for low-income families. Head Start is the second largest federal program. Head Start bypasses states and directly funds pre-K centers for 3- to 4-year-old children from families below 130 percent Federal Poverty Level (FPL). There are also several smaller, targeted child care programs and nonrefundable tax credits to offset middle-income child care expenses.
Solutions
Policymakers at every level can lower the cost of child care for working, low-income families while expanding its availability to other families by reforming regulations, providing effective oversight, increasing parental choice, and addressing benefit cliffs.
Lower Regulatory-Based Cost Increases
States can amend their regulations to lower the cost of child care for families. Regulatory choices often drive cost increases, particularly low staff-to-child ratios, unnecessary credentialing requirements, and overly strict group-size caps. Also, many states also use market rate surveys that inflate reimbursement rates rather than measuring actual child care costs.
- States should carefully reevaluate their regulatory standards, particularly staff credentialling and group ratio requirements. The Administration for Children and Families (ACF) can assist state decision-making by publishing a framework and rewarding states that ease onerous rules in quality-grant competitions.
- States should stop using market-rate surveys, which ask what child care providers charge unsubsidized families and use that inform subsidy reimbursement rates. States should instead use a cost-rate survey that would measure the costs of staffing, wages and benefits, facilities, supplies, enrollment levels, child age, geography, and quality requirements.
- ACF should finalize the Notices of Proposed Rulemaking: “Restoring Flexibility to Support Head Start Program Access” and “Reducing Federal Burden for Head Start Programs” These proposed rules would reduce Head Start costs and extend the assistance to more low-income, working families. States would gain real authority over ratios, group size, background checks, and transportation for Head Start providers in-state for the first time.
Ensure Program Integrity
Child care assistance face integrity concerns. While CCDF’s FY2025 official improper payment rate is 4.93 percent—over $900 million—state investigations have revealed even higher rates. For instance, a 2025 Minnesota HHS-OIG audit found a 19 percent error rate in 200 sampled child care payments and that 11 percent of overall payments had at least one error. In addition, many states don’t track whether parents who receive child care assistance are working.
States can ensure program integrity with these reforms:
- States should monitor and report monthly CCDF data. This should include the number of children receiving CCDF assistance, gender, race, age, and hourly attendance. ACF should create parallel automatic, monthly audits of the same data.
- States can institute new fraud prevention procedures, including routine and risk-triggered attendance audits, independent attendance documentation, automated comparisons of enrollment and payment data, unannounced provider inspections, prompt recovery of overpayments, and referral of suspected intentional fraud for investigation.
- States can track work or education hours to ensure that families are using assistance to seek independence.
- States should publish their child care provider rates, setting, and category online to allow families to see their options and what taxpayers subsidize, which is often hidden from them. ACF can also require care providers who utilize taxpayer funds to be fully transparent. This should include requiring a monthly electronic report from each provider on the number of children receiving CCDF assistance, including attendance hours. It should also assess the provider payments issued, by child, and total per provider.
- ACF should create an automatic state match for improper payments. This would mean that states with a high rate of inaccurate, erroneous, and fraudulent payments would have to pay a financial penalty. The penalty would be a percentage of the child care benefit, like is done in SNAP and Medicaid.
Increase Parental Choice
Parents deserve the freedom to choose the type of child care that best meets their needs. Despite this, most state child care programs prioritize child care centers, the most expensive form of child care. Of the 1.3 million CCDF children served in federal FY2022, 77 percent received care in child care centers. For young children, center-based care is 37 percent more expensive than home-based infant care.
The most recent authorization of the Child Care and Development Block Grant Act clearly intended to prioritize parental choice by individually funding parents. Despite this authority, only one percent of CCDF parents receives their assistance through a mechanism like direct deposits which would allow them to choose the type of care that fits their needs best. Only three states and one territory prioritize parental choice. State-wide flexibility is possible: Hawaii distributes 100 percent of their grant to parents, permitting these parents to choose home-based care which costs far less: $11,632 as compared to the annual $24,115 price tag of center-based care.
- States can create and apply Education Savings Accounts (ESA) for child care funds. States can ensure safety, quality, and access from ESAs by modeling the technology available for FSA and HSA accounts. This would allow parents to graduate from CCDF subsidies to tax credit-based assistance that refund some of the cost of child care. ACF can also make changes to the disclosure requirements in regulation to make sure that ESAs are available to low-income families.
- As part of a new transparency effort, both the state and ACF can publish key data to help low-income working families find the child care options that fit their needs best. This include assessing the type of child care (family care, in-home, center-based) and function (certificate, ESA, voucher) used to pay for the care in every county.
Address Benefit Cliffs
Child care is one of the most extreme state-set benefit cliffs. The Poverty Solution’s CLIFF Index, which measures the severity of U.S. benefit cliffs, found that “CCDF is the dominant cliff in 73 percent of counties.” Earning just $1,000 more can lead to cliffs as dramatic as $25,000. Because states set their CCDF subsidies, they can directly address cutoffs with gradual phasedowns so families can increase earnings without suddenly losing the child care support that makes work possible.
- States should audit the extent of any benefit cliffs embedded into their CCDF subsidies. They should move from annual income checks to continuously assessing income and reducing assistance with real-time increases in earnings. Federal assistance regulations should require states and child care centers to report on beneficiaries’ income and the benefit design of relevant state programs.
- When households depend on multiple programs, benefit cliffs are more prominent and destabilizing. States and ACF should assess the total receipt of safety net benefits by any person in the household and the number of months of receipt.
- Marital status can result in a “marriage penalty” benefit cliff. Two unmarried partners are treated as different households despite sharing the same residence, but married partners are treated as a single household, meaning the unmarried partners could earn the same as the married spouses and still qualify for child care assistance, but the married spouses would not. Policymakers should expand the definition of the household to count the income of all live-in partners regardless of the relationship to children in the home, thus removing the marriage penalty. Likewise, all child care regulations can require eligibility assessments to include the income of all members living in the household, including biological, adoptive, foster, and presumed parents, regardless of marital status, and live-in partners of those parents.
- States should make extensive use of public-private partnerships (PPPs) with employers and nonprofit organizations to leverage private funds and resources. The federal Child Care and Development Block Grant Act specifically mandates that states demonstrate how to take advantage of PPPs to leverage funds and increase the supply of child care services.
Conclusion
The stakes in child care are not abstract. Child care is the often the most significant expense low-income families face. When families cannot afford child care, they risk slipping off the economic ladder into dependency. The good news is that there are ready-to-roll solutions to help them. Federal and state policymakers have the authority, the evidence, and the tools sitting in front of them to reform regulations, increase oversight, give parents the options they need, and eliminate benefit cliffs. Low-income families deserve child care options that meet their efforts to work, earn, and provide.
Endnotes
- Official Data Foundation, “Day Care and Preschool Price Inflation, 1990–2026,” OfficialData.org, accessed September 8, 2026, https://www.officialdata.org/Day-care-and-preschool/price-inflation
- U.S. Bureau of Labor Statistics, “Table 14. Median Usual Weekly Earnings of Full-Time Wage and Salary Workers by Sex, Race, and Hispanic or Latino Ethnicity, 1979–2008 Annual Averages,” Labor Force Characteristics by Race and Ethnicity, 2008, accessed September 8, 2026, https://www.bls.gov/cps/race_ethnicity_2008_14.htm
- Maressa Brown, “This Is How Much Child Care Costs in 2026,” Care.com, February 3, 2026, https://www.care.com/c/how-much-does-child-care-cost/
- Abigail N. Walters, Pamela Joshi, and Leah Shafer, “Who Can Afford Child Care? A National andState Analysis of Affordability for Working Parents,” diversitydatakids.org, February 2026, https://www.diversitydatakids.org/research-library/research-brief/who-can-afford-child-care-nationaland-state-analysis-affordability
- Michael Tanner, “Fixing the Broken Incentives in the U.S. Welfare System,” Foundation for Research on Equal Opportunity, August 19, 2024.
- Bipartisan Policy Center, “Survey Results: What Keeps Employed Parents out of the Child Care System?,” August 8, 2022, https://bipartisanpolicy.org/article/survey-results-what-keepsemployed-parents-out-the-child-care-system/
- U.S. Department of Health and Human Services, Administration for Children and Families, “Restoring Flexibility to Support Head Start Program Access,” proposed rule, Federal Register 91, no. 91 (May 12, 2026): 25,842–25,849, https://www.federalregister.gov/documents/2026/05/12/2026-09383/restoring-flexibility-to-support-head-start-program-access
- U.S. Department of Health and Human Services, Administration for Children and Families, Office of Head Start, “Reducing Federal Burden for Head Start Programs,” notice of proposed rulemaking, 91 Fed. Reg. 51248 (August 7, 2026).
- U.S. Department of Health and Human Services, Fiscal Year 2025 Agency Financial Report (Washington, DC: U.S. Department of Health and Human Services, 2025), 158, https://www.hhs.gov/sites/default/files/fy-2025-hhs-agency-financial-report.pdf
- U.S. Department of Health and Human Services, Office of Inspector General, Minnesota Could Better Ensure That Childcare Assistance Providers Comply With Attendance Requirements, A-05-24-00001 (Washington, DC: HHS-OIG, May 2025), https://oig.hhs.gov/reports/all/2025/minnesota-could-better-ensure-that-childcare-assistance-providers-comply-with-attendancerequirements/
- U.S. Department of Health and Human Services, Administration for Children and Families, Office of Child Care, “FY 2022 Preliminary Data Table 6: Average Monthly Percentages of Children Served in All Types of Care,” 2022, https://acf.gov/occ/data/fy-2022-preliminary-data-table-6
- First Five Years Fund, Child Care & Early Learning in the United States: 2025 State Fact Sheet (Washington, DC: First Five Years Fund, 2025), https://www.ffyf.org/wp-content/uploads/2025/09/2025-National-Fact-Sheet.pdf
- U.S. Department of Health and Human Services, Administration for Children and Families, Office of Child Care, “FY 2023 Preliminary Data Table 2: Child Care and Development Fund Average Monthly Adjusted Number of Families and Children Served,” 2023, https://acf.gov/occ/data/fy2023-preliminary-data-table-2
- Ibid.
- First Five Years Fund, Child Care & Early Learning in Hawaii: 2025 State Fact Sheet (Washington, DC: First Five Years Fund, 2025), https://www.ffyf.org/wp-content/uploads/2025/09/2025-Hawaii-State-Fact-Sheet.pdf
- The Poverty Solution, “CLIFF Index: Methodology & Sources,” last updated March 2026, https://www.thepovertysolution.com/cliff-index/methodology
- Janelle Blackwood, Elias Ilin, and Misuzu Schexnider, Exploring Benefits Cliffs in Illinois: CCAP as a Case Study (Chicago: University of Chicago Inclusive Economy Lab and Federal Reserve Bank of Atlanta, February 2022), https://urbanlabs.uchicago.edu/attachments/14265904df0a33358c29a1c99642f480015e8548/store/6dbbcf726529cc71b3e8ff72cb9c75a30cd0913444f0f9635f9894fa8c13/IEL_ AFRB_Cliffs%2BReport%2B_vFinal_wAuthors.pdf
- This should include Temporary Assistance to Needy Families (TANF) cash assistance, housing assistance, SNAP, Medicaid, Earned Income Tax Credit, the Additional Child Tax Credit, the Low-Income Heating and Energy Assistance Program, Special Supplemental Nutrition Program for Women, Infants, and Children, Supplemental Security Income (SSI), Social Security Disability Insurance, Unemployment Insurance, or any other cash assistance. Current regulation only assesses TANF, housing voucher, SNAP, and SSI.
- Child Care and Development Block Grant Act of 1990, Pub. L. No. 101-508, § 658E(c)(2)(P), 104 Stat. 1388-236 (1990), as amended by the Child Care and Development Block Grant Act of 2014, Pub. L. No. 113-186, § 5, 128 Stat. 1971, 1977–78 (2014).
How Zoning Created America’s Housing Affordability Crisis
by Luca Gattoni-Celli
Policymakers should:
- Significantly curb zoning regulations, which were originally intended to make housing unaffordable to low-income Americans and exclude them from most neighborhoods.
- Ground the building code in empirical evidence and cost-benefit analysis, so it does not add excessive cost to new housing or limit small multifamily projects’ viability.
- Implement rule-based permitting rather than deferring to bureaucratic discretion, so the process does not add unnecessary cost, delay, and uncertainty to development.
- Recognize that, despite good intentions, housing subsidies have major limitations, while rent control and inclusionary zoning make housing scarcer and less affordable.
American housing is punishingly unaffordable. As of 2024, nearly one-in-four American households was cost-burdened, spending more than 30 percent of its income just on housing.1 That comprised about 20.7 million households, up almost one-quarter since 2019. Roughly one-in-ten households was severely burdened, spending more than half of its income on housing.2
The housing affordability crisis prevents many low-income families from pursuing their version of the American Dream: 2024 saw the share of households earning less than $30,000 annually that are cost-burdened rise to a record-high 75 percent.
The root cause of the crisis is a massive shortage, as housing supply has not kept up with demand. Home construction per household has fallen to about half of what it was 40 years ago, yielding fewer new homes in the 1980s, 1990s, and 2010s than in each prior decade, while the U.S. population grew by more than 50 percent from 1980 to 2025, based on Federal Reserve Economic Data and U.S. Census data.3
The pandemic compounded supply problems by prompting residents to flee the most expensive housing markets like California and New York, spiking home prices and rents in the rest of the country, especially in the Mountain West and Sun Belt.
Underbuilding was caused primarily by harmful regulations—zoning, building codes, and permitting—detailed in FREOPP’s housing policy primer and summarized below.4 Building more homes of all types, including multifamily housing and starter homes on small lots, is critical to making housing affordable to Americans of all income levels.
Housing abundance is the only durable strategy for low-income families to have the kinds of homes they need and desire. Filling the shortage will reduce costs for low-income Americans directly in the form of new housing they can afford, and also indirectly by preventing affluent people from bidding up less expensive housing.
Zoning regulations have restricted most residential land in the typical American city to detached single-family homes—the most expensive type of housing—and mandated large, expensive residential lots. This has restricted where low-income families can live by pricing them out of most neighborhoods.
Key zoning reforms would unlock low-cost housing types and enable abundance:
- Allow inherently less expensive multifamily housing to be built, from large apartment buildings that can quickly add lots of housing to a local market, to small multiplexes.5
- Cut minimum parking requirements so property owners can decide how much car parking to build. A 2025 University of Denver study estimated parking reform would boost home production by almost eight percent based on various scenarios.6
- Legalize accessory dwelling units (ADUs), such as backyard cottages and in-law suites. ADUs provide naturally low-cost housing for multigenerational families or renters. California’s ADU boom shows this is a scalable source of new housing.
- Enable starter homes by reducing minimum lot size requirements. Small single-family homes are likely to benefit young couples who wish to have children.7
Legalizing co-living includes allowing more unrelated individuals to live in existing homes and low-cost single-room occupancy (SRO) housing that has shared amenities like kitchens or bathrooms. Co-living survives in many forms, including college dorms, room rental platforms, and gray-market boarding houses, common among young adults. Co-living should be broadly available to low-income people as a foothold for a better life.
So-called “Golden Girls” reform would allow unrelated roommates to live under the same occupancy limits as related persons. Co-living does not sacrifice safety or impose significant externalities on neighbors. Nuisance laws and health and safety regulations still apply and should be enforced. Best practices to keep SRO buildings safe include screening tenants, clear leases, and laws to ensure the eviction of unsafe residents.
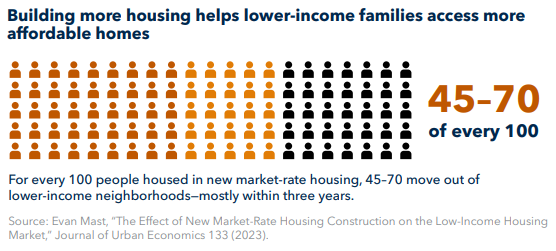
Building more housing creates “vacancy chains” that quickly make inexpensive homes available to many low-income families. The people who move into new housing vacate less expensive housing, which lower-income people move into, who vacate even less expensive housing, which lower-income people move into, and so on. A 2023 study by economist Evan Mast found that market-rate housing for 100 people leads 45 to 70 people to move out of low-income neighborhoods, mostly within three years.8
U.S. building codes’ excessive requirements add significant costs beyond what is needed to ensure safety and structural integrity. Prime examples include mandating large elevators and fire safety requirements that are not consistently grounded in empirical evidence. The expensive commercial building code applies to all new U.S. housing with more than two residential units—except for townhouses—limiting small multifamily housing that would help more families live in desirable neighborhoods.9
Building code reforms to expand multifamily housing would allow lower-income families to split the cost of residential lots in high-demand areas with abundant opportunity.
- The cheaper, non-commercial U.S. residential building code should be applied to buildings with up to eight units, making them much cheaper to build.
- Allowing single-stair apartment buildings up to six stories—rather than the current three or four—would allow much more housing to be built on small existing lots.
Local permitting is discretionary and often slow, imposing costly delays and unnecessary expenses on new housing. This dysfunction discourages, complicates, and even kills residential projects, worsening the housing shortage and raising prices.
- Local departments should coordinate and schedule multiple inspections in parallel.
- Architects and structural engineers should be able to self-certify, completing training with a building department to take responsibility for building code compliance.10
- States should enact “shot clocks” for local action on permit and inspection requests.
- Certified third-party reviewers should be allowed to examine and approve or deny a permit application that the government has not acted upon in a timely manner.
Deregulating housing would directly address the shortage by enabling new supply, so its benefits are fairly straightforward. By contrast, government attempts to directly reduce housing costs have significant limitations, often worsening the shortage and affordability.
Abundant supply would make housing subsidies such as vouchers more effective, helping people who truly need them. Housing subsidies are a targeted tool for financial support, but not a scalable solution, because they subsidize demand and raise prices. All subsidized housing has this limitation, including committed “affordable housing.”
Other demand-side interventions are even more damaging. Rent control is popular but worsens shortages and housing quality.11 Rent stabilization in Montgomery County, Maryland, for example, dramatically reduced multifamily housing production.12 “Inclusionary zoning” requires that some share of a multifamily building’s units be income-restricted. The policy dramatically raises costs, resulting in far fewer homes.13
The American Dream is, at its core, the opportunity to build a better life, which requires being able to choose where to live. Rather than being a financial burden holding them down, housing should be a stable foundation on which Americans build a better life.
Endnotes
- Joint Center for Housing Studies of Harvard University. The State of the Nation’s Housing 2026 (Cambridge, MA: Joint Center for Housing Studies of Harvard University, 2026), Page 5, https://www.jchs.harvard.edu/sites/default/files/reports/files/Harvard_JCHS_The_State_of_the_Nations_Housing_2026_0.pdf.
- Joint Center for Housing Studies, State of the Nation’s Housing 2026, Page 5. The report says 24 percent of U.S. households, at 20.7 million, were cost-burdened in 2024, and 9.6 million were severely cost-burdened. The report gives no percentage for the second metric, but the other figures imply 11.13 percent, about one-in-ten.
- U.S. Census Bureau; U.S. Department of Housing and Urban Development via FRED, “New Privately Owned Housing Units Complete: Total Units/Total Households; New Privately-Owned Housing Units Started: Total Units/Total Households,” retrieved from FRED, Federal Reserve Bank of St. Louis, accessed September 3, 2026, https://fred.stlouisfed.org/graph/?g=1pdN2#; Wikipedia, s.v. “1980 United States census,” accessed September 3, 2026, https://en.wikipedia.org/wiki/1980_United_States_census; U.S. Census Bureau, “Slow Growth Impacts Nation’s Largest Counties Hardest,” press release, March 26, 2026, https://www.census.gov/newsroom/press-releases/2026/2025-popest-metro-micro-counties.html#:~:text=Table%201.%20Population%20and%20Population%20Change%20by%20County%20Size%20in%202025%3A%202023%2D24%20vs.%202024%2D25.
- Luca Gattoni-Celli, “The U.S. Housing Shortage and How Zoning, Building Codes, and Permitting Created It,” FREOPP (Foundation for Research on Equal Opportunity), accessed September 3, 2026, https://freopp.org/whitepapers/the-u-s-housing-shortage-and-how-zoning-building-codes-and-permitting-created-it/.
- Yonah Freemark, “Which Neighborhoods Have Added the Most Housing Units in the Past Five Years?,” Urban Institute, June 18, 2026, https://www.urban.org/urban-wire/which-neighborhoods-have-added-most-housing-units-past-five-years.
- University of Denver and Terner Labs, Examining Relationships between Eliminating Parking Minimums and New Housing Construction Using a Terner Housing Simulator Tool (July 2025), https://law.du.edu/sites/default/files/2025-07/Examining%20Relationships%20between%20Eliminating%20Parking%20Minimums%20and%20New%20Housing%20Construction%20Using%20a%20Terner%20Housing%20Simulator%20Tool%20-%20August%202025%20r2.pdf.
- Wendell Cox and Lyman Stone, “Homes for Young Families: A Pro-Family Housing Agenda,” Institute for Family Studies, March 2025, https://ifstudies.org/report-brief/homes-for-young-families-a-pro-family-housing-agenda.
- Evan Mast. 2023. “JUE Insight: The effect of new market-rate housing construction on the low-income housing market.” Journal of Urban Economics 133: 103383. https://www.sciencedirect.com/science/article/abs/pii/S0094119021000656.
- Sam Naylor and Luc Schuster, “Unlocking Small Multifamily Housing through Building Code Reform,” Boston Indicators, July 14, 2026, https://www.bostonindicators.org/building_codes.
- City of Chicago Department of Buildings, “Self-Certified Permit Application Program,” City of Chicago, accessed September 3, 2026, https://www.chicago.gov/city/en/depts/bldgs/provdrs/permits/svcs/self-cert-permits.html.
- Jen Sidorova, “Unintended consequences of rent control,” Reason Foundation, December 26, 2024, https://reason.org/commentary/unintended-consequences-of-rent-control/.
- Adam Pagnucco, “MoCo Multifamily Permits Drop 96 Percent with Rent Control,” Montgomery Perspective, January 6, 2026, https://montgomeryperspective.com/2026/01/06/moco-multifamily-permits-drop-96-percent-with-rent-control/.
- Illinois Policy Institute, “Report: Chicago lost out on 43,000 homes because of zoning mandates,” October 1, 2025, https://www.illinoispolicy.org/press-releases/report-chicago-lost-out-on-43000-homes-because-of-zoning-mandates/.
A Grid Built for Growth
by Grant Dever
Policymakers should:
- Modernize and streamline permitting. The time it takes to permit, build, litigate, and connect a new project to the grid is a major factor in the cost of building new power generation.
- Codify recent nuclear reforms to create regulatory certainty. Executive policy guidance can be the baseline for new legislation to most efficiently supply the American grid.
- Reform transmission cost allocation and reward utilities for cheaper upgrades. States can seek to socialize the costs of their policies onto ratepayers in other states. Congress should pair sensible interregional cost-allocation rules with an incentive for utilities to upgrade transmission.
- Allow development of off-grid power generation that can compete with existing utilities for large industrial consumers. New data centers could more readily be built off-grid, addressing concerns that industrial demand will generate costs that will be socialized and passed on to ratepayers.
Energy unaffordability is hitting lower-income Americans hard. As of September 2024, 43.8 percent of adults in households earning under $25,000 were unable to pay an energy bill at least once in the preceding 12 months. An estimated 56.2 percent of Americans in this income bracket—over 15 million adults—reported that they cut out basic household necessities to pay an energy bill.1 The poorest fifth of American households spend a median of 9.8 percent of their income on energy, compared to 1.2 percent for the top quintile of American households.2
The average price of residential electricity rose by about 33 percent in nominal terms from 2019 to 2025, outpacing inflation.3 According to data from Federal Reserve Economic Data (FRED), electricity Consumer Price Index (CPI) rose 12 percent from January 2010 to December 2019 while broader inflation rose 19 percent.4 Since 2022, that relationship has flipped and household electricity inflation has outpaced all-items CPI. Electricity inflation will continue to be an issue if supply cannot meet new demand.
Energy affordability is not a transient issue that will resolve itself over the next few years. Electricity demand forecasts have accelerated since 2022, ending a decade and a half of flat growth.5 Data centers, reindustrialization, and electric vehicles and heat pumps are all creating new demand for electricity.6 Grid planning areas file ten-year peak-demand forecasts with the Federal Energy Regulatory Commission (FERC).7 FREOPP analyzed these filings and found that the projected increase in demand has risen roughly sevenfold from 2022 to 2026. The filings from June 2026 forecast that an additional 151 GW of peak demand will be added to the grid by 2030. Assuming a 15 percent reserve margin, the United States would need to add net capacity at nearly twice the pace it did over the last decade.
Grid planners’ filings deserve to be scrutinized, especially when they are projecting that demand will grow far faster than in recent decades. Roughly 65 percent of the forecast growth in the 2018 to 2020 filings materialized. Assuming 65 percent of the filed 151 GW of demand materializes, the United States would still need to add over 98 GW of capacity to meet additional peak demand, plus capacity to maintain reserve margins.8 How much of this demand materializes is contingent upon the ability of developers to build the requisite supply. If the United States cannot build the required power generation, then many of these projects will be built abroad, creating economic opportunities and generating tax revenues elsewhere while depriving Americans of the energy they need for homes and businesses.
Americans’ utility bills rose partially because utilities needed to invest capital into expanding and maintaining existing infrastructure, without rising demand to help absorb the cost. Utilities earn a regulated return based on capital expenditure investment less depreciation. Investor-owned utilities invested $1.3 trillion (nominal) in total capital expenditures from 2015 to 2024. In grid regions with flat or declining demand, ratepayers will see their bills continue to rise as projects are placed in service and enter the rate base. Costs have also risen due to natural gas volatility and wildfire damage that likewise raised prices for ratepayers.9
New industrial demand can help spread fixed grid costs over more kilowatt-hours. If these costs rise while demand declines or stays flat, then utilities will need to raise rates on their existing customers. A larger share of these fixed costs must then fall onto households, even if their personal usage stays relatively flat. However, when a new industrial customer is added to the grid, or an existing company expands their operation, the fixed costs from these prior investments can now be shared with them. This can result in customers’ bills declining or rising slower than they otherwise would have.
The demand surge provides a unique opportunity for policymakers to deliver reforms that protect ratepayers from unnecessary costs, allow supply to grow, and release American ingenuity from the burdens of excessive bureaucracy. Higher demand will create new economic opportunities for Americans and can help finance necessary upgrades to the United States’ energy infrastructure. The policy challenge is not to figure out how to deter large load customers, but how to ensure that this investment protects ratepayers, supports investment in critical infrastructure, and raises real wages for Americans. Rising demand is only a problem if it leads to higher costs that are socialized onto households, instead of being internalized by the companies. Congress should pass reforms that will give states the opportunity to protect consumers.
Federal policies to protect ratepayers
Modernize and streamline permitting. The time it takes to permit, build, litigate, and connect a new project to the grid—whether coal, nuclear, natural gas, geothermal, or renewable—is a major factor in the cost of building new power generation. The Breakthrough Institute found that energy projects spent a median of three years in litigation between final agency approval and a final court ruling.10 Even when a project is ultimately built, years of litigation create future uncertainty that reduces investment. Legislation like the FREEDOM Act—which sets enforceable deadlines for administrative agencies, offers expedited judicial review for project sponsors, and would protect projects that have received final permits from unilateral executive actions—can serve as a bipartisan solution to ensure that rising demand leads to lower real electricity prices and greater economic opportunity for Americans.11 These reforms will protect ratepayers by making it easier for private capital to invest in energy infrastructure and reducing project costs incurred by unnecessary delays.
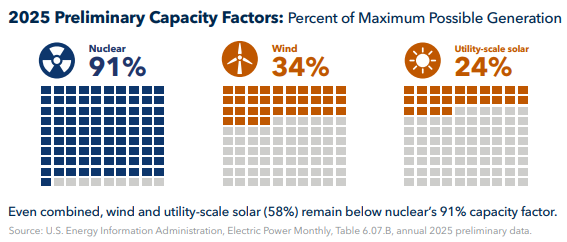
Codify recent nuclear reforms to create regulatory certainty. Nuclear power plants can help meet rising demand and improve grid reliability because of their high capacity factor—the electricity they generate in a given year as a proportion of their maximum possible output—and their exemplary power density—the amount of power generated per unit of land area required. The United States’ nuclear reactors operated at a preliminary capacity factor of 91 percent in 2025, compared with 58 percent for combined cycle natural gas, 34 percent for wind, and 24 percent for utility-scale solar.12 The comparatively high capacity factors of nuclear power plants enables a reliable output of large amounts of electricity. This consistency makes it easier for grid planners to ensure that there will be sufficient power to meet demand and mitigate the risks of rolling blackouts caused by extreme weather.
Nuclear power plants can generate immense power using a fraction of the land required for other sources. This quality of nuclear power makes these power plants differentiated in their ability to help a large city, like New York, to decarbonize its power production. Wind and solar power require at least an order of magnitude more land to generate the same amount of power as a nuclear power plant.13 In order to scale renewables to decarbonize a major city, a utility would need to build transmission lines that bring the power from distant renewable energy projects. From 2010 to 2021, it took on average over 10 years to build a transmission line in the United States.14 States that are antagonistic to natural gas power generation and want to meaningfully address reliability concerns in their cities need a federal and state regulatory environment that will accelerate the development and commercialization of new nuclear reactors.
President Trump’s 2025 executive orders and the Nuclear Regulatory Commission’s recent actions seek to accelerate investment and research and development of new nuclear reactors. Congress should build on the ADVANCE Act by codifying recent reforms to provide long-term regulatory certainty for investors and entrepreneurs.15 New legislation should:
- Establish enforceable, predictable licensing deadlines. Require the NRC to reach a final decision on a substantially complete new reactor application within 18 months. Require the NRC to reach a final decision to continue operating an existing reactor within one year.
- Create standardized and expedited licensing pathways for reactor designs that the Department of Energy (DOE) or Department of Defense has already tested and demonstrated operate safely. Streamline the process for repeat deployments of microreactors and modular reactors.
- Codify DOE’s authority to approve qualified test reactors under its jurisdiction, streamline environmental reviews at federal research sites. Authorize public-private projects that deploy reactors at DOE and military sites.
Reform transmission cost allocation, and reward utilities for cheaper upgrades. All else equal, residents who purchase their power from a cost-of-service utility will face higher bills as utilities invest in new energy infrastructure. While there are existing ratepayer protections, utilities are incentivized to take on expensive capital projects that grow their rate base and increase their authorized returns. This becomes a complex issue when transmission projects serve ratepayers across multiple states, as state policy can further warp incentives as states seek to socialize the costs of their policies onto ratepayers in other states. Existing lines can be reconductored or upgraded to expand deliverable transmission capacity in a capital-efficient way.16 Congress should pair sensible interregional cost-allocation rules with an incentive for utilities to upgrade transmission when it would be more cost-effective than building new lines.
Allow development of off-grid power generation that can compete with existing utilities for large industrial consumers. In most states, companies can only purchase power directly from the grid or provide their own power. In order to create an off-grid utility, the would-be utility needs to be approved by the state public utility commission. This requirement effectively prohibits the creation of new, off-grid utilities that can provide power to multiple industrial customers with the prices negotiated directly between the utility and their customers. Travis Fisher and Glen Lyons call this innovative arrangement Consumer Regulated Electricity (CRE).17 With CRE, new data centers and manufacturing could more readily be built off-grid, addressing concerns that industrial demand will generate costs that will be socialized and passed on to ratepayers. This would help to resolve issues under certain market structures, like in the PJM Interconnection, where the capacity market does socialize costs that should be borne directly by large industrial loads.18 In January 2026, Senator Tom Cotton (R., Ark.) introduced the Decentralized Access to Technology Alternatives Act (DATA Act) to help make CRE a viable option. The DATA Act would exempt islanded off-grid utilities serving new customers from federal utility regulation that will otherwise inhibit states’ ability to experiment with CRE.19
The United States is set to spend more than one trillion dollars building infrastructure to power and support an economy that requires much more power.20 This investment can spur economic growth and lead to falling real prices, or it can be undermined by ossified permitting processes and serial litigation. Without reform, American ratepayers are likely to continue to see their costs rise, especially in states whose plan to address rising demand is to encourage it and the economic opportunities that accompany it to go elsewhere.
Congressional and state leaders need to take action to protect ratepayers by making it easier to invest in and build energy infrastructure and other capital intensive industries within the United States. If Congress punts on permitting reform and the status quo continues unabated, ratepayers will see their prices continue to rise. Inaction will lead to higher utility bills that will further erode the budgets of lower-income households.
Endnotes
- U.S. Census Bureau, “Table 4: Household Energy Use and Spending in the Last 12 Months, by Select Characteristics,” Household Pulse Survey, Cycle 09, August 20–September 16, 2024, https://www2.census.gov/programs-surveys/demo/tables/hhp/2024/cycle09/housing4_cycle09.xlsx.
- U.S. Census Bureau, “2024 American Community Survey: 1-Year Estimates—Public Use Microdata Sample,” https://www.census.gov/programs-surveys/acs/microdata/access/2024.html.
- U.S. Energy Information Administration, Electric Power Monthly, table 5.3, “Average Price of Electricity to Ultimate Customers,” https://www.eia.gov/electricity/monthly/epm_table_grapher.php?t=epmt_5_03.
- Federal Reserve Bank of St. Louis, Federal Reserve Economic Data, series CUSR0000SEHF01, “Consumer Price Index for All Urban Consumers: Electricity in U.S. City Average,” https://fred.stlouisfed.org/series/CUSR0000SEHF01; series CPIAUCSL, “Consumer Price Index for All Urban Consumers: All Items in U.S. City Average,” https://fred.stlouisfed.org/series/CPIAUCSL.
- U.S. Energy Information Administration, “Electricity Data Browser: Retail Sales of Electricity,” annual U.S. all-sector sales, https://www.eia.gov/opendata/browser/electricity/retail-sales.
- John D. Wilson et al., Power Demand Forecasts Revised Up for Third Year Running, Led by Data Centers (Washington, DC: Grid Strategies, November 2025), 3–4, https://gridstrategiesllc.com/wp-content/uploads/Grid-Strategies-National-Load-Growth-Report-2025.pdf.
- Federal Energy Regulatory Commission, “Form No. 714—Annual Electric Balancing Authority Area and Planning Area Report,” https://www.ferc.gov/industries-data/electric/general-information/electric-industry-forms/form-no-714-annual-electric/overview.
- Foundation for Research on Equal Opportunity, unpublished analysis of FERC Form 714 planning-area forecasts, report years 2021–2025, compiled using Public Utility Data Liberation, version 2026.8.0.
- Ryan Wiser et al., Factors Influencing Recent Trends in Retail Electricity Prices in the United States (Berkeley, CA: Lawrence Berkeley National Laboratory and The Brattle Group, October 2025), https://eta-publications.lbl.gov/sites/default/files/2025-10/full_summary_retail_price_trends_drivers.pdf.
- Breakthrough Institute, The Procedural Hangover: How NEPA Litigation Obstructs Critical Projects (Berkeley, CA: Breakthrough Institute, July 24, 2025), 5, https://thebreakthrough.imgix.net/A-Comprehensive-Analysis-of-NEPA-Litigation_v6.pdf.
- Grant Dever, “The FREEDOM Act: Permitting Reform to Protect Ratepayers,” FREOPP Blog, Foundation for Research on Equal Opportunity, July 7, 2026, https://freopp.org/oppblog/the-freedom-act-permitting-reform-to-protect-ratepayers/.
- U.S. Energy Information Administration, Electric Power Monthly, tables 6.07.A and 6.07.B.
- Hannah Ritchie, “How Does the Land Use of Different Electricity Sources Compare?” Our World in Data, June 16, 2022, https://ourworldindata.org/land-use-per-energy-source.
- International Energy Agency, “Average Lead Times to Build New Electricity Grid Assets in Europe and the United States, 2010–2021,” 2023, https://www.iea.org/data-and-statistics/charts/average-lead-times-to-build-new-electricity-grid-assets-in-europe-and-the-united-states-2010-2021.
- On the ADVANCE Act and related executive directives, see U.S. Nuclear Regulatory Commission, “About the ADVANCE Act,” last updated August 11, 2026, https://www.nrc.gov/about-nrc/governing-laws/advance-act/about-advance-act; Exec. Order No. 14,299, 90 Fed. Reg. 22,581 (May 29, 2025); Exec. Order No. 14,300, 90 Fed. Reg. 22,587 (May 29, 2025); Exec. Order No. 14,301, 90 Fed. Reg. 22,591 (May 29, 2025); Exec. Order No. 14,302, 90 Fed. Reg. 22,595 (May 29, 2025); and Enabling Nuclear Energy Innovation, 42 U.S.C. § 16278 (2026), https://uscode.house.gov/view.xhtml?edition=prelim&num=0&req=granuleid%3AUSC-prelim-title42-section16278.
- Idaho National Laboratory, Advanced Conductor Scan Report (Washington, DC: U.S. Department of Energy, 2023), 123, https://www.energy.gov/sites/default/files/2024-08/Advanced%20Conductor%20Report%20December%202023.pdf.
- Travis Fisher and Glen Lyons, The Case for Consumer-Regulated Electricity: Private Electricity Grids Offer a Parallel Path to Energy Abundance, Cato Institute Briefing Paper no. 196 (Washington, DC: Cato Institute, February 3, 2026), https://www.cato.org/briefing-paper/case-consumer-regulated-electricity-private-electricity-grids-offer-parallel-path.
- Monitoring Analytics, Analysis of the 2027/2028 RPM Base Residual Auction, Part A (Eagleville, PA: Monitoring Analytics, January 5, 2026), https://www.monitoringanalytics.com/reports/Reports/2026/IMM_Analysis_of_the_20272028_RPM_Base_Residual_Auction_Part_A_20260105.pdf.
- Decentralized Access to Technology Alternatives Act of 2026, S. 3585, 119th Cong. (2026), https://www.govinfo.gov/content/pkg/BILLS-119s3585is/html/BILLS-119s3585is.htm.
- Edison Electric Institute, EEI Industry Capital Expenditures 2015–2029, 1.
How Competition Can Make Health Care More Affordable
by Gregg Girvan
Policymakers should:
- Offer Americans access to universal—and universally affordable—coverage for today while remaining fiscally sustainable for future generations.
- Give Americans the freedom to choose health coverage that is tailored to their needs.
- Ensure that subsidies to help pay for coverage are reserved for those who truly need it.
- Lower costs by advancing policies that promote competition and curtail the power of health care monopolies.
The escalating cost of health care in the United States presents a critical challenge to millions of Americans. Recent studies indicate that more than 110 million Americans have medical debt, with 65 million having bills that are past due or they are unable to pay.1 In fact, the cost of hospital care as a share of median household income in the United States now exceeds the median household’s federal tax liabilities.2
The cost of prescription drugs continues to rise rapidly and increasingly burdens Americans, even when they are not currently taking medication. While prescription drugs account for about 10.6 percent of personal health care spending,3 they account for 24.2 cents of every insurance premium dollar.4 The rising cost of physician services and long-term care further compound the cost crisis in American health care.
This crisis has two major consequences. First, 30 million Americans lack access to affordable health insurance5 while many others with coverage struggle to maintain that coverage due to high premiums and cost-sharing requirements. Second, runaway government spending on health care programs such as Medicare, Medicaid, the Affordable Care Act, and military and veterans care continues to fuel America’s mounting debt and deficits, contributing to inflation in health care as well as the rest of the economy.
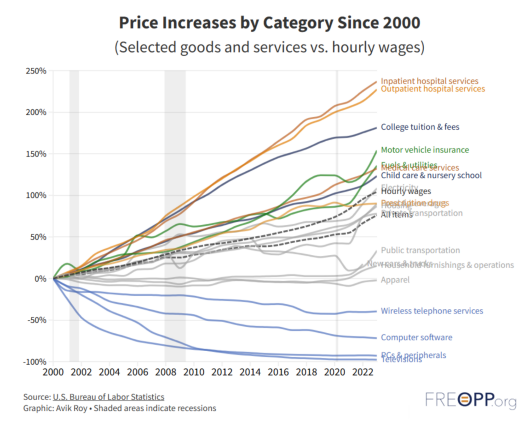
Since 2000, overall health care prices have risen more than 121 percent,6 faster than hourly wages (104 percent).7 Moreover, hospital care costs rose faster than all other major categories of spending in the U.S. economy at over 230 percent.8 As these costs rise, they pose a threat both to the well-being and longevity of Americans.
Americans deserve better. They deserve a health care system with affordable coverage options for everyone while remaining fiscally sustainable for generations to come.
Fortunately, through a host of federal executive actions and legislative proposals, as well as state-driven reforms, the United States can achieve this vision by advancing a handful of key principles, including:
- Offering Americans access to universal—and universally affordable—coverage for today while remaining fiscally sustainable for future generations
- Giving Americans the freedom to choose health coverage that is tailored to their needs
- Ensuring that subsidies to help pay for coverage are reserved for those who truly need it
- Lowering costs by advancing policies that promote competition and curtail the power of health care monopolies
Federal policies to improve health care affordability
Legislation: The Fair Care Act
Legislation provides the best path for permanent improvements in the cost and availability of health care. Drawing upon several bipartisan reform proposals, The Fair Care Act (FCA), introduced by Rep. Bruce Westerman (R., Ark.), provides a blueprint for comprehensive health care reform.9
First, the FCA achieves universal coverage by encouraging uninsured residents to directly purchase insurance. It accomplishes this by reducing the underlying cost of care through market-based reforms and reforming the design flaws in the ACA. It also permanently expands eligibility for premium tax credits, from a current range of 100-400 percent FPL to everyone at 600 percent FPL or below.
Second, the FCA expands coverage options so Americans can purchase a health plan that fits their needs. It would fully legalize short-term limited-duration insurance plans first recognized in Trump-era regulation, integrate the Federal Employees Health Benefits Program (FEHBP) into the FCA’s insurance marketplaces to create economies of scale, and consolidate tax advantaged savings accounts such as Health Savings Accounts and Flexible Spending Accounts into single funds called Medisave Accounts (MDAs).
Third, the FCA promotes fairness to taxpayers by funding the premium tax credit expansion to the working poor and middle class while eliminating federal health care subsidies for the wealthy, closing the Medicaid provider tax loophole in all states,10 and eliminating the ability of hospitals to charge higher prices at physicians offices they own.
Finally, the FCA promotes innovation and competition to lower the cost of health care for patients in a number of ways. It does so by empowering the Federal Trade Commission to investigate hospital mergers and other anticompetitive behavior, incentivizing regional hospital monopolies to divest subsidiaries to increase competition, and allowing insurance carriers to jointly negotiate reimbursement rates for providers and prescription drugs. The FCA also codifies and improves the Trump administration’s executive actions on price transparency and increases uptake of more affordable generic and biosimilar drugs.
Executive Actions
While permanent health care reform requires Congressional action, achieving bipartisan consensus on major legislation is difficult and takes time. In the near-term, the president has options to extend reform absent comprehensive legislation.
- Private insurance reform. In 2021, the Biden administration revoked a Trump-era executive order promoting association health plans, short-term limited-duration plans, and health reimbursement arrangements (HRAs). The administration should refocus attention on these beneficial arrangements by reducing regulatory barriers for small employers and expanding their use in the gig economy. These forms of coverage give patients affordable and flexible options and provide vital financial protection from catastrophic illness. HRAs are also an important vehicle for employers to provide health coverage without the burden of administering health plans for employees. Additionally, the administration should build on prior efforts to expand access to health savings accounts and to explore reference pricing to help drive down costs.
- Antitrust enforcement. Consolidation in hospital and provider markets represent one of the biggest drivers of higher health care prices in the United States. Though the Federal Trade Commission has a responsibility to challenge anticompetitive mergers and other business practices throughout the economy, the agency has taken little action to address consolidation in the health care industry. To the extent possible under existing budgets and authority, the president should shift focus away from antitrust action where no clear consumer harm has been demonstrated and instead focus on addressing the health care market where evidence clearly shows higher consumer prices11 without better outcomes.12 Additionally, the administration should oppose practices such as certificate of need laws and all-or-nothing contract terms between providers and insurers13 to help states curb anticompetitive practices that prevent the development of new hospitals and competition between existing providers.
- Price transparency. Building on Trump-era regulations that require hospitals to publish prices and insurance-negotiated rates on an array of services, the president can strengthen such measures, including increasing penalties for noncompliance. Additionally, the president can allocate funds to other transparency initiatives, such as developing all-payer claims databases so researchers can report on trends in health care prices across the industry.
State policies to improve health care affordability
State lawmakers play important roles and possess several policy levers to improve health care affordability for their residents.
- Reducing state barriers to insurance options. Though most employer-based plans are regulated under federal laws, states have influence over the strength of their own individual markets and can encourage participation in affordable, flexible insurance arrangements. A promising model of insurance choice is the individual coverage health reimbursement arrangement (ICHRA). The model functions similar to a defined contribution retirement plan, in that an employer contributes a certain amount of money to an employee to use to purchase his or her own insurance, in contrast to a defined benefit arrangement where the employer selects the plan offerings for the employee. 14 While the parameters of ICHRAs are regulated under federal law, states can encourage greater participation in ICHRAs in a number of ways.15 States such as Indiana and Mississippi passed laws to offer small employers a tax credit for each covered employee.16 Texas is considering exempting participating small businesses from a state’s sales tax.17 Florida has explored the option of creating an ICHRA marketplace,18 a dedicated online portal that makes shopping for coverage easier for employees and overcomes a common objection with ICHRA adoption: that employees will be easily overwhelmed when choosing a health plan for themselves.
- Containing health care costs for state employees. States have significant control over state employee health benefits, including how plans are operated and financed, as well as what plans are offered. States should explore alternative payment strategies within state employee benefits to lower costs for both employees and taxpayers. One strategy that has accelerated in recent years involves benchmarking prices for certain health care services and procedures to payment rates in public health programs like Medicare, a process known as reference pricing. Diverse states such as Arkansas, California, Montana, Oklahoma, Oregon, South Carolina, and Washington employ different reference price designs to control costs,19 with some allowing payments to hospitals as low as 200 percent of Medicare rates. Because state employee plans are among the largest purchasers of coverage in their respective states, such plans leverage their market power through reference prices to not only bring prices down, but also maintain broad provider participation; a dual benefit that is more difficult for individual coverage insurers to attain.
- Curbing the monopolistic behavior of providers, especially hospitals. States have broad authority over how, when, and where providers can practice, influencing the competitive balance of local health care markets. In ways similar to enhanced FTC enforcement, state attorneys general should more aggressively challenge health system mergers that reduce competition and lead to higher prices for patients. States can fight against monopolistic providers in other ways as well. As is the case with states implementing reference prices for state employee health plans, states can condition hospitals’ tax-exempt status on reducing prices to a benchmark. Indiana is the first state to implement such a policy,20 targeting especially high-priced non-profit hospitals by stripping them of their tax exempt status unless they reduce prices to the nationwide average. States can also follow Indiana’s lead by requiring hospitals to offer such prices directly to employers, bypassing traditional insurance company negotiation.
- Reforming provider licensing requirements and scope of practice rules. Rather than protecting patients by ensuring high quality providers, state licensing requirements often do little more than protect providers’ economic interests by setting artificial barriers to provider competition. Since all states have robust licensing requirements, states should recognize licensing of providers from other states to encourage providers to move across state borders. In addition, states should expand scope of practice laws to allow lower-cost professionals to practice at the highest level of care they can safely provide to patients. Finally, states should liberalize residency requirements that allow qualified international providers to practice in their states rather than repeat residency training they have completed outside the United States.
The Road Ahead
The high cost of health care threatens America’s promise of prosperity. A health care system that continually demands more while delivering less acts as a tax on work, entrepreneurship, and economic opportunity. Yet with every problem of this magnitude, there is also enormous opportunity for change. The federal and state governments can achieve a more affordable and sustainable system if they commit to reforms that give patients more choice, reserve assistance for those who truly need it, and reduce costs through competition.
Endnotes
- “Health Care Debt In The U.S.: The Broad Consequences Of Medical And Dental Bills,” Kaiser Family Foundation, last modified August 9, 2025, https://www.kff.org/health-costs/kff-health-care-debt-survey/#c7f7c77b-dec4-4baf-bed1-78e3522b4f46
- “Affordable Hospital Care Through Competition and Price Transparency,” Foundation for Research on Equal Opportunity, last modified September 8, 2025, https://freopp.org/whitepapers/affordable-hospital-care-through-competition-and-price-transparency/
- “National Health Expenditure Data,” Centers for Medicare and Medicaid Services, last modified September 22, 2025, https://www.cms.gov/data-research/statistics-trends-and-reports/national-health-expenditure-data
- “Where Does Your Healthcare Dollar Go?,” America’s Health Insurance Plans, published October 24, 2024, https://www.ahip.org/resources/where-does-your-health-care-dollar-go
- “Federal Subsidies for Health Insurance, 2026 to 2036,” Congressional Budget Office, published July 23, 2026, https://www.cbo.gov/publication/62539
- “Healthcare price & use indices,” Peterson-KFF Health System Tracker, last modified February 19, 2026, https://www.healthsystemtracker.org/indicator/spending/price-index/
- “Overview of BLS Wage Data by Area and Occupation,” Bureau of Labor Statistics, last modified September 24, 2024, https://www.bls.gov/bls/blswage.htm
- “Health Care Services in the Producer Price Index,” Bureau of Labor Statistics, last modified September 16, 2025, https://www.bls.gov/ppi/factsheets/producer-price-index-healthcare-factsheet.htm
- “H.R.8840 – Fair Care Act of 2026,” Congress.gov, accessed September 4, 2026, https://www.congress.gov/bill/119th-congress/house-bill/8840
- Medicaid provider taxes are fees states levy on hospitals to pay for the Medicaid program. States collect the tax, and then return the tax to providers as inflated Medicaid payments for medical services to extract more federal matching dollars.
- James C. Robinson, “Hospital Market Concentration, Pricing, and Profitability in
- Nancy D. Beaulieu, Ph.D., et al., “Changes in Quality of Care after Hospital Mergers and Acquisitions,” New England Journal of Medicine 382, no. 1 (2020): 51-59, https://www.nejm.org/doi/full/10.1056/NEJMsa1901383
- Certificate of Need laws require providers to get permission from the government before building new facilities or expanding services. Hospitals include All-or-Nothing contract terms with insurers, which stipulate insurers must include all of a health system’s hospitals and physicians or none of them.
- “What is a defined-benefit plan?,” healthinsurance.org, last modified March 30, 2026, https://www.healthinsurance.org/glossary/defined-benefit-plan/
- Brynn Stadtmueller, “States that have health benefit tax credits for small businesses,” Stretch Dollar, April 17, 2026, https://www.stretchdollar.com/posts/states-that-have-health-benefit-tax-credits-for-small-businesses
- Stadtmuller, “States that have health benefit tax credits.”
- “Text for 89(R) SB 1949,” Texas Legislature Online, accessed September 4, 2026, https://capitol.texas.gov/BillLookup/Text.aspx?LegSess=89R&Bill=SB1949
- “SB 440: Florida Employee Health Choices Program,” The Florida Senate, accessed September 4, 2026, http://flsenate.gov/Session/Bill/2026/440
- “State Spotlight: The Use Of Provider-Based Reference Pricing In Oklahoma And South Carolina,” Health Affairs Forefront, January 28, 2025, https://www.healthaffairs.org/content/forefront/state-spotlight-use-provider-based-reference-pricing-oklahoma-and-south-carolina
- “IN HB1004 Health care matters,” Bill Track 50, accessed September 4, 2026, https://www.billtrack50.com/billdetail/1780795
How Tariffs Make Goods Unaffordable
by Michael Tanner
Policymakers should:
- Repeal trade laws that empower the executive branch to restrict trade without congressional approval.
- Reduce or eliminate tariffs on all imported products except where national security is directly implicated.
Bringing down the cost of living will be a complex process that will not be accomplished overnight. But one thing that policymakers can do that will have a swift impact would be to stop making the problem worse. Policies that make goods and services more expensive should be subject to intense scrutiny and tariffs should be at the top of the list.
Start with the basics: A tariff is a tax. Worse, it is a highly regressive tax that falls hardest on those who can least afford it: low-income Americans.
Economists debate precisely how much of this tax falls on consumers versus domestic importers and foreign exporters. Legally, any American tariff is paid by U.S. importers. However, the bulk of those costs are passed down the supply chain until they reach consumers at the retail level.
Even worse, price increases aren’t confined to the tariffed products. Domestic producers, protected from competition by lower-cost foreign competitors, have more leeway to increase their prices. For example, during President Trump’s first term, when the United States slapped 20-50 percent tariffs on imported washing machines like LG and Samsung, American producer Whirlpool hiked its washer prices by 12 percent.
And, as price hikes work their way through the supply chain, even products produced downstream from the original tax payment have their costs and thus prices rise as well.
The true costs of this administration’s tariffs to any particular American family are difficult to calculate because the tariffs keep changing. Some have been struck down by courts but then were replaced by new tariffs with different rationales that trigger a new round of legal challenges. Others are imposed and dropped, raised or lowered at the president’s whim, despite the Congressional authority to impose taxes and tariffs.
Since it can take as long as seven months for the increased costs of tariffs to affect retail prices, the tariff may have been raised, lowered, or eliminated before consumers feel the full impact. Roughly $100 billion in illegally imposed tariffs was refunded to importers following the Supreme Court’s decision in Learning Resources Inc. v. Trump, but very little of that sum has been used for consumer relief.
The Tax Foundation estimates that in 2025, the Trump tariffs amounted to an average tax increase of $1,000 per U.S. household. Other studies have put the per-family cost in 2025 even higher, perhaps as much as $1,700 per household. And, even with the Supreme Court striking down most “Liberation Day” tariffs, the average U.S. household will pay another $900 in 2026.
Tariff-induced increases in the cost of living likely harmed low-income and working-class Americans the most. Because tariffs are effectively a tax on consumption, and lower-income families devote a greater share of their income to consumption, the tax costs them the most in relative terms. In addition, tariffs are more likely to be imposed on lower-end goods and necessities—and at higher rates—than they are on luxury goods. For example, basic canvas sneakers or low-cost synthetic shoes face tariffs as high as 67 percent, while high-end, all-leather luxury shoes often are tariffed at 8.5 percent or less.
Even modest price increases caused by tariffs can add up quickly over time for low-income workers, significantly eroding purchasing power compared to those who have more of a financial cushion. And, with limited savings or other resources to fall back on, low-income workers must often resort to credit to cover increasing prices, where they face high interest rates and other costs.
Looking at how the tariffs affected specific sectors provides additional evidence of how much tariffs raise the cost of living.
Groceries: The U.S. imports roughly $220 billion in food products each year. After various exemptions and exclusions, roughly half of these imports remain subject to tariffs. The Yale Budget Lab estimated that tariffs have driven up overall grocery costs by 1.6 to 2.8 percent. Seafood, beef, fruit, coffee, wine, nuts, rice, cheese, and chocolate likely saw even bigger price rises. Nor is it easy for consumers to avoid tariff-induced price rises by switching to domestically produced equivalents. Many agricultural staples—pineapples or bananas, for instance—simply cannot be widely grown in the United States. Tariffs on foodstuffs hit low-income Americans particularly hard, as they already spend one-third of their pre-tax income on food.
Housing: Although most of the blame for high housing costs comes from zoning regulations, tariffs play a role as well. Softwood lumber, used for framing, and imported mostly from Canada, have been subject to some of the Trump administration’s highest tariffs. Indeed, lumber prices have hit a four-year high. Copper and steel—necessary for plumbing and wiring, among other things—are heavily tariffed as well. Even gypsum, a component of drywall, is included in Trump’s tariff regime. All together, the National Association of Home Builders estimates that tariffs add $10,000–$17,500 to the cost of a new home.
Durable goods: Home appliances, consumer electronics, and furniture by the Trump administration’s tariffs. Estimates of how much tariffs raised prices vary significantly from product to product but have generally been put between 4 and 15 percent. Policymakers should understand that, when Vice President J.D. Vance contemptuously says, “a million cheap, knockoff toasters aren’t worth the price of a single American manufacturing job,” he ignores that many Americans cannot afford more expensive toasters.
Automobiles: Tariffs add roughly $1,600 to $2,000 to the cost of a U.S. assembled vehicle, and as much as $6,000 to 9,000 to an import. Many automakers have discontinued smaller, less expensive models altogether because of tariffs. Replacement parts are likewise subject to the tariffs, raising the cost of auto repairs thus increasing auto insurance premiums. Americans are therefore left with fewer less-expensive vehicle options, meaning they either have to pay more or forgo buying a car.
Pharmaceuticals: According to a study by the Federal Reserve Bank of St. Louis, non-generic prescription drugs were subject to more than a four percent price increase, one of the highest tariff-induced price increases. Tariffs put health-improving and other necessary medications further out of reach for more Americans. That needless suffering likely to get worse since the Trump administration has announced that it will impose 100 percent tariffs on generic drugs starting in 2028. Analysts warn that this could cost an average family around $600 per year in additional costs. The tariffs could result in shortages of some critical drugs.
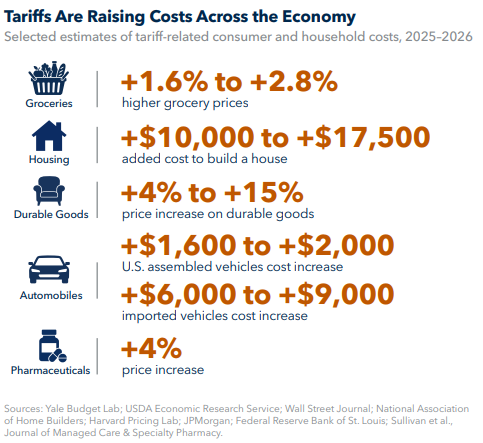
All told, tariffs are having particularly damaging effects on the cost of living for those whose family budgets have little or no wiggle room.
If tariff costs were offset by increased employment and higher wages, perhaps they would make more economic sense, but they simply do not. In the months following the announcement of Trump’s “Liberation Day” tariffs, which were meant to support American factories, the U.S. lost 90,000 manufacturing jobs. Nominal wage growth for private sector workers generally—and manufacturing workers specifically—declined in the aftermath of tariff announcements. Overall, analysts believe that the Trump tariffs have reduced U.S. GDP by 0.4 percent or nearly $130 billion.
Nor have tariffs raised anywhere near the amount of revenue expected or claimed by President Trump. The president has promised that tariff revenue would fund everything from payments to farmers to consumer rebates to the elimination of the federal income tax. The tariffs brought in just $264 billion in revenue in 2025. Much of that is now being refunded to importers in the wake of the Supreme Court’s decision.
There are many reasons why tariffs and other trade restrictions are generally a bad idea: they can reduce economic growth, disrupt relations with American allies, and make domestic producers less innovative, less efficient, and less competitive. But tariffs are particularly painful for lower-income Americans who are struggling with the already high cost of living.
Of course, policymakers should keep in mind that the benefits of freer trade are not equally distributed, with some workers and industries inevitably paying a price for goods bought elsewhere. Policymakers should help affected workers when necessary, with workforce development programs and other support to get them back on their feet. Even so, policymakers concerned with the cost of living should take immediate steps to reduce or eliminate most tariffs in order to reduce prices, expand jobs, and increase economic growth.
Endnotes
- Ann Swanson and Brad Plumer, “Trump Slaps Steep Tariffs on Washing Machines and Solar Products,” New York Times, Jan 22, 2018, https://www.nytimes.com/2018/01/22/business/trump-tariffs-washing-machines-solar-panels.html.
- Kelsey Dallas, “Tariff Refund Reaches $100 Billion Mark,” SCOTUSblog, August 6, 2026, https://www.scotusblog.com/2026/08/tariff-refunds-reach-100-billion-mark/.
- Joint Economic Committee Minority, “American Families Have Paid More Than $1,700 Each in Tariff Costs Since Trump Entered Office,” February 2026, https://www.jec.senate.gov/public/_cache/files/7cc03e65-d40a-465f-9e88-09dd53d3502f/jec-fact-sheet-on-cost-of-tariffs-for-families-update.pdf.
- Miguel Acosta and Lydia Cox, “The Regressive Nature of the U.S. Tariff Code: Origins and Implications,” Cato Institute, September 8, 2022, https://www.cato.org/research-briefs-economic-policy/regressive-nature-us-tariff-code.
- Yale University Budget Lab, “Where We Stand: The Fiscal, Economic, and Distributive Effects of All U.S. Tariffs Enacted in 2025 Through April 2.” April 2, 2025, https://budgetlab.yale.edu/research/where-we-stand-fiscal-economic-and-distributional-effects-all-us-tariffs-enacted-2025-through-april.
- U.S. Department of Agriculture, Economic Research Service, “Food Prices and Spending.” Updated June 1, 2026, https://www.ers.usda.gov/data-products/ag-and-food-statistics-charting-the-essentials/food-prices-and-spending
- Ryan Dezember, “Home Building is Sputtering, but Lumber Prices Haven’t Been So High in Years,” Wall Street Journal, August 5, 2026, https://www.wsj.com/finance/commodities-futures/home-building-is-sputtering-but-lumber-prices-havent-been-so-high-in-years-a2ef1cf2?mod.
- “How Tariffs Impact the Home Building Industry,” National Association of Home Builders, 2026, https://www.nahb.org/advocacy/top-priorities/building-materials-trade-policy/how-tariffs-impact-home-building.
- Alberto Cavallo, et al. “Tracking the Short-Run Impact of U.S. Tariffs.” Harvard Business School Pricing Lab, January 30, 2026, https://www.pricinglab.org/files/TrackingTariffs_Cavallo_Llamas_Vazquez.pdf.
- Jose Asumendi, “Who Will Pay the Price for U.S. Auto Tariffs?” JPMorgan, September 25, 2025. JPMorgan article https://www.jpmorgan.com/insights/global-research/autos/auto-tariffs.
- Maximiliano Dvorkin et al., “How Tariffs are Affecting Prices in 2025,” Federal Reserve Bank of St. Louis, On the Economy Blog, October 16, 2025. https://www.stlouisfed.org/on-the-economy/2025/oct/how-tariffs-are-affecting-prices-2025.
- Sean Sullivan et al., “The Consequences of Pharmaceutical Tariffs in the United States,” Journal of Managed Care & Specialty Pharmacy, Vol.31, No.6 https://doi.org/10.18553/jmcp.2025.25090.
- Ryan Mulholland and Kennedy Andara, “One Year After Liberation Day, American Workers are Feeling the Negative Effects of the Trump Administration’s Tariffs,” Center for American Progress, March 17, 2026, https://www.americanprogress.org/article/one-year-after-liberation-day-american-workers-are-feeling-the-negative-effects-of-the-trump-administrations-tariffs/.
- Ibid.
- Erica York and Alex Durante, “Tracking the Impact of the Trump Tariffs.” Tax Foundation, September 2, 2026, https://taxfoundation.org/research/federal-tax/trump-tariffs-trade-war/.
- Rachel Snyderman and Andrew Lautz, Caleb Quakenbush, Aaron Till, and Upamanyu Lahiri, “How Much Are U.S. Tariffs Raising in Revenue?” Bipartisan Policy Center, May 2026. https://bipartisanpolicy.org/explainer/tariff-tracker/.
The American Dream on Borrowed Money
by Michael Tanner
Policymakers should:
- Hold the rate of increase in federal spending to less than the rate of increase in economic growth.
- Reform Social Security and Medicare to preserve their solvency, while reducing future unfunded liabilities.
- Address affordability by reducing the regulatory burdens that artificially limit supply of necessary goods and services, rather than through increasing subsidies.
The United States is racing down a road to fiscal disaster. Low-income Americans will be hurt most by this irresponsibility as things become increasingly unaffordable.
The U.S. national debt currently stands at more than $40 trillion, slightly more than 100 percent of GDP, or greater than the value of all goods and services produced in the country this year. That’s as if someone’s credit card bills were bigger than their entire salary.
On the current trajectory, the story only gets worse. The Congressional Budget Office (CBO) warns that the debt will top $63.7 trillion (135 percent of GDP) within the next decade. That is likely an underestimate, since it assumes that several popular tax cuts are allowed to expire as scheduled.
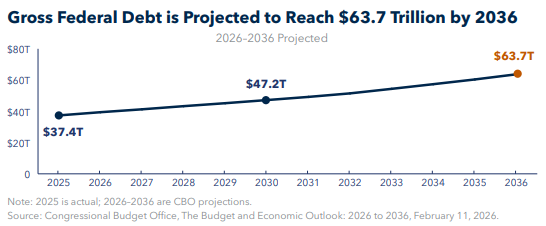
As the numbers get ever larger and congressional inaction is taken for granted, the public largely tunes out. In ways both large and small, this tide of red ink is driving up the cost of living and making a wide range of goods and services unaffordable, especially for low- and middle-income earners.
How does the debt raise the cost of living for Americans? Here are a few of the ways:
Higher interest rates: Government debt drives up interest rates across the broader economy. As a rule of thumb, the CBO estimates that every one percent increase in the debt to GDP ratio results in a two basis point (0.02 percentage points) hike in interest rates. This, in turn, makes everyday consumer borrowing—such as auto loans, credit cards, and mortgages—more expensive. Kent Smetter, faculty director of the Penn Wharton Budget Model, estimates that roughly 60 percent of the recent rise in U.S. Treasury yields—the return or interest rate that the government pays on its bonds—is due to expectations that the United States will continue to run massive deficits. Higher treasury yields translate into higher interest rates for consumers. The Yale Budget Lab suggests the increased cost of borrowing adds roughly $2,500 per year to the cost of a typical 30-year mortgage, and $120 to the annual cost of an auto loan. That puts home- and car-ownership out of reach for many low-income Americans.
Inflation: While the effect of the debt on inflation is not always as obvious or direct as it is for interest rates, it is significant nonetheless. To the degree that deficit spending, financed by borrowing, puts money in the hands of consumers faster than the supply of goods increases, prices inevitably rise. At the same time, the Federal Reserve, in an attempt to keep interest rates from spiking, is buying government bonds paid for by creating new bank reserves. This effectively increases the money supply, leading to a situation where too much money is chasing too few goods. The net result is that every dollar can purchase fewer goods and services, while sending prices up. According to the Yale Budget Lab, five years after the national debt increases by an amount equal to one percent of GDP, the average American family could lose up to $1,250 in purchasing power.
Worse, as prices rise and economic growth and wages are unable to keep pace, consumers increasingly turn to credit cards and other forms of high-interest borrowing in order to make ends meet. With the national debt driving up interest rates, families get trapped in a debt/inflation feedback loop.
While inflation is problematic across the economy, it falls hardest on low-income Americans. That is because they typically already have smaller, less-flexible budgets and lower savings, so any increase in prices hurts them more acutely. Moreover, poorer Americans typically devote a larger share of their budget to essentials like food, housing, and transportation, which are disproportionately affected by rising prices. Goods like these tend to exhibit inelastic demand, meaning that even slight price increases can significantly erode purchasing power.
Slower economic growth: Even as the debt drives up the cost of living, it also slows the economic growth that would enable families to earn more and offset rising costs. High levels of public debt can crowd out private investment, resulting in lower productivity and ultimately lower wages. According to the CBO, income per person in 2050 will be as much as $6,300 lower than it would have if policymakers were able to reduce the debt level to 79 percent of GDP, still high by historical standards. Another study, from the Peter G. Peterson Foundation, warns that if the debt remains on its current trajectory, the economy will produce 1.2 million fewer jobs by 2035 and wages will be lower than they would without the debt burden.
A review of 80 empirical studies from 2010–2025 estimates that every one percent in the debt-to-GDP ratio above 100 percent results in a 0.033 percent decrease in economic growth. Given the current level of debt and its expected increase, that would lower this year’s GDP growth roughly 0.8 percent points lower than it would be otherwise. This might not seem like a big deal, but compounded over time, it means far fewer jobs and lower wages in the future. These pressures apply while prices increase, causing low-income families to feel the pinch from every angle.
Crowding-out needed assistance: This year, interest payments on the national debt will amount to more than $1 trillion, roughly 14 percent of all federal government spending and more than half of the estimated $1.6 trillion the government spends on safety net programs. That is $1 trillion that cannot be spent on other programs or tax cuts targeted at helping those most in need. Indeed, since the middle-class entitlements Medicare and Social Security are off-limits—the traditional third rail of American politics—and the Trump administration wants to dramatically increase defense spending, any spending cuts are likely to fall most heavily on programs for the poor.
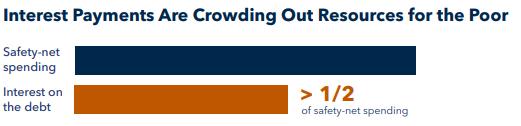
There are few clean hands when it comes to blame for the debt, nor is there much difference between Democrats and Republicans. George W. Bush added $6.1 trillion to the debt over eight years. Barack Obama topped that, increasing the debt by another $9.3 trillion. President Trump’s first term was actually a mild improvement, running up just $7.8 trillion in additional debt. President Biden looks almost fiscally responsible, generating just $4.7 trillion during his single term, though he benefited from post-COVID economic growth. But bipartisan profligacy has regained momentum in President Trump’s second term. In just a year and a half, he has already added another $2.25 trillion to the debt.
Worse, as the affordability crisis grows, many of the proposals for dealing with it—particularly from the populist left and right—are likely to make the problem worse. For example, many politicians want to subsidize essential goods and services from housing to child care. But to the degree those subsidies are financed by borrowing, they risk simply increasing the debt. At the same time, financing them through higher taxes carries the risk of slowing economic growth, thereby reducing job growth and lowering wages. Moreover, subsidies increase demand without increasing supply, thus increasing inflationary pressures and likely raising prices for those goods. Pumping subsidies into rental housing in, say, San Francisco, without addressing the severe supply constraints will only increase rents, requiring ever-more inflationary subsidies in a never-ending cycle that ignores the underlying problems.
At the same time, attempts to cajole the Fed into lowering interest rates prematurely are likely to be self-defeating, marking a return to the loose money policies of the COVID-era that generated record levels of inflation. Or, if one thinks that COVID was a special case, consider the 1970s when low-interest rates and an expanding monetary supply led to extremely high inflation. The Federal Reserve ultimately had to raise interest rates to as much as 20 percent to break the inflationary cycle.
Ultimately, there are only two ways to reduce the debt without doing more harm than good. First, policymakers must address the regulatory burdens that artificially limit supply. Cities need to build more housing, make child care more widely available, and so on. The goal should be to lower prices by expanding the availability of those goods, not simply shift costs from individuals to taxpayers.
Second, Congress must both reduce spending and increase growth. If the rate of economic growth exceeds the rate of government spending, the burden of debt to GDP will naturally shrink over time. However, both growth and spending restraint are necessary to achieve this. Projections that economic growth can be high enough that spending restraint is unnecessary are based on wildly unrealistic scenarios.
Debt reduction is seldom discussed in relation to affordability. But until both parties begin to take it seriously, there will be little chance of bringing down the cost of living over the long term.
Endnotes
- “What is the Federal Debt?” United States Department of the Treasury, https://fiscaldata.treasury.gov/americas-finance-guide. Accessed September 4, 2026.
- “The Budget and Economic Outlook: 2026 to 2036,” Congressional Budget Office, February 11, 2026, https://www.cbo.gov/publication/61882.
- Andre Neveau and Jeffrey Schafer, “Revisiting the Relationship Between Debt and Long-Term Interest Rates: Working Paper 2024–25,” Congressional Budget Office, December 20, 2024, https://www.cbo.gov/publication/60314.
- Abhi Gupta, “The Impact of Deficits on Costs for Households,” The Budget Lab at Yale, March 9, 2026, https://budgetlab.yale.edu/research/impact-deficits-costs-households.
- Julian di Giovanni, et al., “Quantifying the Inflationary Impact of Fiscal Stimulus under Supply Constraint,” Federal Reserve Bank of New York Staff Reports, no. 1050 (2023), https://www.newyorkfed.org/research/staff_reports/sr1050.
- Gupta.
- Jackson Mejia and John Hartley, “Inflations Compounding Impact on the Poor,” Foundation for Research on Equal Opportunity. https://freopp.org/whitepapers/inflations-compounding-impact-on-the-poor/.
- “The 2020 Long-Term Budget Outlook” Congressional Budget Office, September 2020, https://www.cbo.gov/publication/56516.
- “The Rising National Debt Will Cause Significant Economic Damage.” Peter G. Peterson Foundation, May 2025, https://www.pgpf.org/wp-content/uploads/2025/05/EY-Rising-National-Debt-Will-Cause-Significant-Economic-Damage.pdf.
- Jack Salmon, “The Impact of Public Debt on Economic Growth: What the Empirical Literature Tells Us,” Mercatus Center, January 7, 2026, https://www.mercatus.org/research/policy-briefs/impact-public-debt-economic-growth-what-empirical-literature-tells-us.
- “Interest Costs on the National Debt,” Peter G. Peterson Foundation, 2026, https://www.pgpf.org/programs-and-projects/fiscal-policy/monthly-interest-tracker-national-debt/.
How to Fix the College Affordability Crisis
by Renu Mukherjee
Policymakers should:
- Enact institutional risk-sharing, which would force institutions that accept Title IV funding to bear direct responsibility for their graduates’ economic outcomes.
- Set caps on loans and federal aid by a degree program’s projected Return on Investment (ROI), so programs whose graduates produce strong earnings and high repayment rates qualify for higher borrowing limits, whereas those with poor outcomes do not.
- Condition state funding of public universities and any subsidies on student outcomes and positive-ROI programs, which would align both student and taxpayer investments with actual economic value.
America’s colleges and universities are facing an affordability crisis. In 1980, the average inflation-adjusted price to attend a four-year college or university full-time was $10,231 for tuition, fees, and room and board. By the 2025–26 academic year, that figure reached $30,990: a real-term increase of roughly 203 percent.1 In fact, college tuition has risen faster than any other household expense since 1983, outpacing health care, housing, and gas.2 Meanwhile, total outstanding federal student debt surpassed $1.6 trillion in 2024, with roughly one-quarter owed by borrowers whose degrees are not expected to generate enough lifetime earnings to justify the cost.3
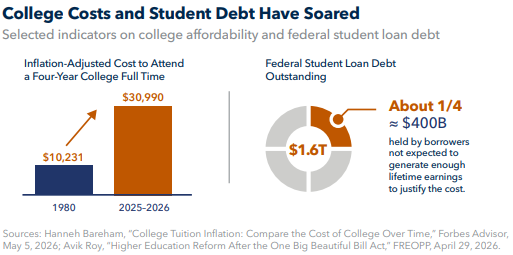
This affordability crisis is deeply troubling because rising costs put college out of reach for many low-income families. For generations of Americans, a college degree served as a clear engine of upward mobility. With ingenuity, hard work, and determination, students could earn a credential that all but secured their place in the middle class or beyond.
At least, that was the promise of the Higher Education Act (HEA) of 1965: to expand access by making college more affordable.4 Signed into law by President Lyndon Johnson as part of the Great Society, the HEA sought to democratize postsecondary education by establishing the first federal grant program for undergraduate tuition, a federally guaranteed loan system, and a framework of aid to colleges and universities that remains active today. The law was meant to ensure, Johnson noted, that “a high school senior anywhere in this great land of ours can apply to any college or any university in any of the 50 states and not be turned away because his family is poor.” 5
Unfortunately, the opposite happened. College costs have skyrocketed over the past four decades because Title IV of the HEA—the provision governing student aid—never tied funding to student outcomes. As FREOPP Chairman Avik Roy explains
The student was the nominal beneficiary of the grant or loan, but the money passed through his or her hands without stopping. Whether the student could repay the loan, whether the degree he or she obtained would be worth anything in the labor market, and whether the college had any stake in the answer to either question were never addressed in the original statute because none of these questions were the ones the bill’s drafters were asking.6
Since 1965, federal aid to colleges and universities has continued to expand, driving up costs while remaining entirely disconnected from student outcomes. During the 1970s, Congress broadened grant and loan programs without evaluating whether these subsidies translated into meaningful wage gains for students. The problem worsened in 1980 with the creation of the Parent PLUS Program, which extended federal loans to parents on behalf of their children with no borrowing caps or traditional underwriting.7 Then, in 2005, Congress introduced Grad PLUS. Replacing the previous $18,500 annual graduate borrowing limit, this program allowed students to borrow up to an institution’s full cost of attendance without any income check, employment verification, or debt-to-income evaluation. Similar toParent PLUS, borrowers only had to show they did not have “adverse credit history.” 8 By the time the federal government fully took over student lending in 2010, borrowing had become the primary source of tuition financing for graduate programs, along with many undergraduate programs.9
Title VIII of the One Big Beautiful Bill Act (OBBBA) tried to bring these unchecked costs back under control. It phased out the Grad PLUS program and imposed annual ($20,000) and aggregate ($65,000) limits per dependent on Parent PLUS. The law also replaced the federal government’s complex array of income-driven repayment plans with two streamlined options.10
Most significantly, the OBBBA wrote a direct, earnings-based accountability test into federal statute. The law now revokes Title IV eligibility for any program whose graduates fail to meet certain earnings benchmarks. For undergraduate programs, the baseline is the median earnings of working adults aged 25 to 34 in the institution’s state holding only a high school diploma. For graduate and professional programs, the benchmark is the lowest of three candidate medians: state working adults with a bachelor’s degree; state working adults in the same field with a bachelor’s degree; or U.S. working adults in the same field with a bachelor’s degree. Finally, the OBBBA introduced the Workforce Pell Grant, extending Pell Grant eligibility to short-term occupational programs lasting between 8 and 15 weeks (150 to 600 instructional hours).11
Still, the federal government can go further to solve the college affordability crisis. It should enact reforms, such as:
- Strengthen the earnings-based accountability benchmarks written into the OBBBA As originally designed, the law sets the threshold for Title IV eligibility extremely low; undergraduate programs need only show median graduate earnings of $36,000 to $45,000 four years after completion.12 Congress should replace this floor with a new benchmark based on net ROI. FREOPP’s Return on Investment in Higher Education methodology, for example, calculates ROI by weighing post-graduation earnings against forgone income during enrollment, discounting future earnings to present value, and considering the earnings a similar worker could expect without the credential. This methodology shows that approximately 23 percent of bachelor’s degrees and 50 percent of master’s degrees produce a negative ROI.13 Developing a benchmark modeled on FREOPP’s formula would deny Title IV eligibility to these underperforming programs, which leave students and taxpayers financially worse off.
- Enact institutional risk-sharing Under the current system, colleges and universities are guaranteed federal tuition revenues upfront while transferring 100 percent of the risk of non-repayment onto students and taxpayers. Instead, institutions that accept Title IV funds should bear direct responsibility if their students fail to repay their loans.
As Roy has proposed, Congress should create a risk-adjusted, risk-sharing formula to ensure that institutions serving economically disadvantaged populations are not unfairly penalized under this policy framework:
- The secretary of education should build a federal database that connects every Title IV recipient to their entering characteristics—such as Pell status, family income, first-generation status, and field of study—with their long-term outcomes (completion rates, loan balances, and 4-, 6-, 8-, and 10-year post-graduation earnings).
- Next, the secretary should develop a risk-adjustment formula. Under this formula, “a Pell-eligible, first-generation student from a ZIP code in the bottom decile of median family income receives,” Roy explains, “a high risk score; a non-Pell student from an affluent ZIP code receives a low risk score.” It can then be used to calculate an expected aggregate repayment value for every institution based on how its students perform compared to similar students nationally.
- The federal government would then be able to compare each institution’s repayment performance against its risk-adjusted benchmark. Colleges and universities that exceed expectations should receive rewards, while those that fall short should be penalized.14
- Set ROI-based loan caps While the OBBBA placed limits on graduate borrowing, it failed to impose meaningful caps on undergraduate student loans. Instead of relying on fixed statutory limits—set at $5,500, $6,500, and $7,500 depending on whether the student is a freshman, sophomore, or upperclassman—the federal government should tie annual loan caps to a program’s projected ROI.15 Under this approach, programs whose graduates produce strong earnings and high repayment rates would qualify for higher borrowing limits, whereas those with poor outcomes would not.
- Impose basic underwriting requirements The federal government should also establish an underwriting requirement—or mandate an eligible co-signer—for the Parent PLUS program. Indeed, this remains the only federal loan program without any serious ability-to-repay standard.16
It is unlikely, however, that federal solutions alone will solve the college affordability crisis. State governments should seek to curb runaway costs as well. States can take several steps, including:
- Tie state appropriations to graduates’ labor-market outcomes State legislatures should condition appropriations for public universities on former students’ earnings and career success, rather than mere enrollment numbers. Doing so would align taxpayer investments with actual economic value.17
- Exercise strict oversight over Workforce Pell approval Governors should use the statutory authority granted under the OBBBA to establish a rigorous, data-driven screening process, authorizing Workforce Pell eligibility only for programs tied to high-skill, high-wage, and in-demand occupations.18
- Direct in-state tuition subsidies toward positive-ROI programs States should tie state-funded tuition discounts to program ROI. Degree programs that generate positive lifetime net present value for students should receive the full in-state tuition differential, the full merit scholarship, and the full need-based grant aid the state offers, while those that generate a slightly negative lifetime ROI should receive partial subsidies. By contrast, programs that generate a lifetime ROI well below zero should receive no subsidies.19 This would ensure that taxpayer dollars support only those degrees that leave students financially better off.
- Curb credential inflation in state hiring States should review job descriptions across public positions, identify those where a college degree is listed but not necessary, and replace the requirement with skills-based hiring processes.20
Since the passage of the HEA in 1965, federal aid to colleges and universities has been disconnected from student success, driving tuition inflation while insulating institutions from real accountability. Meaningful reform, however, is achievable at the federal and state levels. By enacting institutional risk-sharing, strengthening earnings-based accountability benchmarks, setting ROI-based loan caps, imposing underwriting requirements, and aligning state funding of public colleges and universities with economic outcomes, policymakers can hold institutions responsible for their graduates’ financial futures. These reforms would ensure that American postsecondary education once again serves as an engine of upward mobility for students, particularly those on the bottom rungs of the economic ladder.
Endnotes
- Hanneh Bareham, “College Tuition Inflation: Compare the Cost of College Over Time,” Forbes, May 5, 2026, https://www.forbes.com/advisor/student-loans/college-tuition-inflation/#:~:text=In%201980%2C%20the%20price%20to%20attend%20a,the%20average%20annual%20cost%20sitting%20around%20%2430%2C990.
- J.P. Morgan, “Tuition Inflation,” https://am.jpmorgan.com/us/en/asset-management/adv/investment-strategies/college-planning-essentials/viewer/college-costs/cpe-ccinflation/.
- Avik Roy, “Higher Education Reform After the One Big Beautiful Bill Act,” The Foundation for Research on Equal Opportunity, April 29, 2026, https://freopp.org/whitepapers/higher-education-reform-after-the-one-big-beautiful-bill-act/.
- Roy, “Higher Education Reform.”
- Lyndon B. Johnson, “Remarks at Southwest Texas State College Upon Signing the Higher Education Act of 1965,” November 8, 1965, https://www.presidency.ucsb.edu/documents/remarks-southwest-texas-state-college-upon-signing-the-higher-education-act-1965.
- Roy, “Higher Education Reform.”
- Roy, “Higher Education Reform.”
- Ben Cecil, “How We Got Here: The Rise and Fall of the Grad PLUS Loan Program,” Third Way, December 4, 2025, https://www.thirdway.org/memo/how-we-got-here-the-rise-and-fall-of-the-grad-plus-loan-program.
- Roy, “Higher Education Reform.”
- Roy, “Higher Education Reform.”
- Roy, “Higher Education Reform.”
- Roy, “Higher Education Reform.”
- Preston Cooper, “Does College Pay Off? A Comprehensive Return On Investment Analysis,” The Foundation for Research on Equal Opportunity, May 8, 2024, https://freopp.org/whitepapers/does-college-pay-off-a-comprehensive-return-on-investment-analysis/#6c4b.
- Roy, “Higher Education Reform.”
- Roy, “Higher Education Reform.”
- Roy, “Higher Education Reform.”
- Avik Roy, “A State Agenda for Higher Education Reform,” The Foundation for Research on Equal Opportunity,” June 4, 2026, https://freopp.org/whitepapers/a-2026-state-agenda-for-higher-education-reform/.
- Roy, “A State Agenda.”
- Roy, “A State Agenda.”
- Roy, “A State Agenda.”