



Executive Summary
On March 31, 2026, the CMS Interoperability and Prior Authorization Final Rule forced every Medicare Advantage (MA) contract, Medicaid managed-care plan, and exchange issuer to publish prior-authorization metrics for the first time. We use these disclosures to construct a Wrongful-Denial Index: a transparent, reproducible estimate of how often a plan denies care it later reverses on appeal. Because an overturned denial is, by the plan’s own subsequent review, a denial that should not have stood, overturn data offer the cleanest public signal of initial-determination error. Some rate of error is inevitable in any process that reviews tens of millions of requests, and this work is not premised on a world of zero denials. It is designed to reveal when reversals rise far beyond what good-faith clinical review can explain.
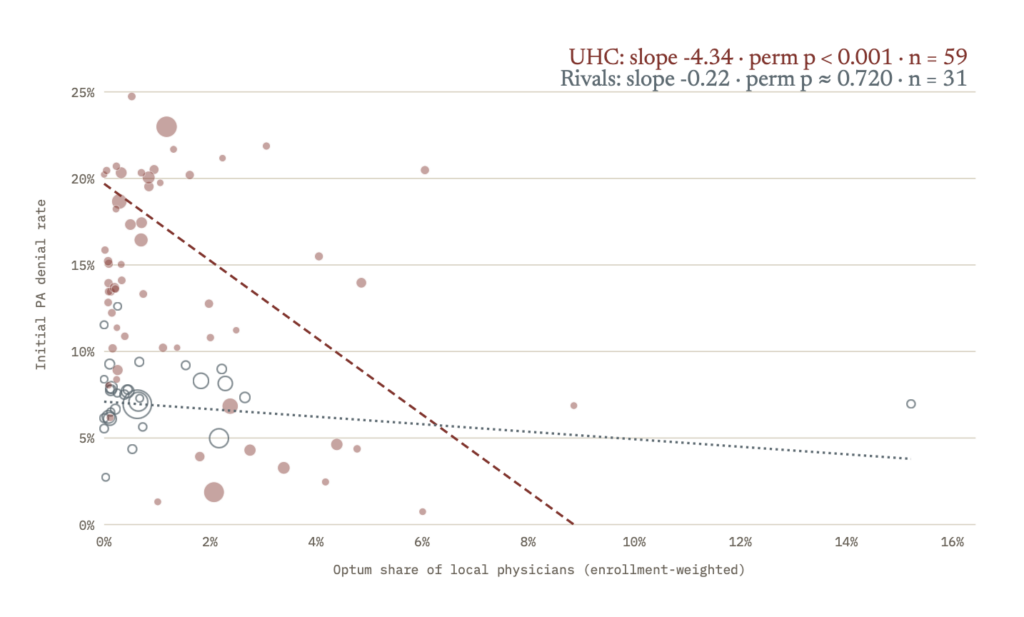
We find that prior authorization eases where the insurer employs the health care providers. Across UnitedHealthcare’s 59 geographically matched Medicare Advantage contracts, each percentage point of Optum’s share of local physicians is associated with a 4.3-percentage-point lower denial rate (p<0.001), while a rival-insurer placebo on Humana’s 31 geographically matched contracts shows no relationship at all (slope −0.22, p=0.72). The gradient is specific to the insurer that owns the providers, consistent with prior authorization operating as a throttle on care the insurer must purchase externally rather than a neutral clinical screen. In short, who absorbs the difference matters. A prior-authorization denial reverses by default unless the patient or physician fights it, and the people least able to mount that fight—lower-income enrollees without the time, health care literacy, or advocate to navigate an appeal—are the ones most likely to simply go without the care. The same denials that an integrated insurer waves through for its own patients fall hardest on those at the bottom half of the economic ladder, for whom a wrongly denied scan, drug, or nursing-home stay is not an inconvenience to be appealed but care that never happens.
This paper reports fully reconstructed results for the two largest Medicare Advantage insurers—UnitedHealthcare’s and Humana’s complete MA books, gathered directly from their CMS-0057-F public filings—alongside published federal benchmarks, with a rival-insurer placebo test of the central finding. The findings lead to three suggested policy reforms: require every plan to file its metrics in one standardized, machine-readable public repository; require approval rates to be reported separately for insurer-owned and independent providers, so integrated self-dealing is visible in every filing; and attach escalating consequences to persistently high overturn rates:the system’s own admission of error.
Introduction
For decades, prior authorization operated as one of the least observable processes in American health care. Physicians submitted requests, and insurers approved or denied them. Outside each transaction, almost no one could see the aggregate pattern:how often plans said no, how long they took, or how often patients who pushed back ultimately won.
That changed with the CMS Interoperability and Prior Authorization Final Rule (CMS-0057-F), finalized in January 2024. Among its provisions, the rule requires impacted payers—Medicare Advantage (MA) organizations, state Medicaid and Children’s Health Insurance Programs (CHIP), Medicaid and CHIP managed-care entities, and Qualified Health Plan issuers on the federal exchanges—to publish a defined set of prior-authorization metrics on their public websites each year. The first reports, covering calendar year 2025, were due March 31, 2026. These requirements deserve support: disclosure is the market-oriented alternative to blunt prohibition, and the required fields—volumes, denials, appeal outcomes, decision times—are the right ones to demand. The trouble, as this paper shows, is execution: the posted data are self-computed, scattered across dozens of websites, and aggregated in ways that defeat easy comparison.
The stakes are large and measurable. By KFF’s accounting, Medicare Advantage insurers alone processed roughly 52.8 million prior-authorization determinations in 2024, denied about 4.1 million of them (a 7.7 percent denial rate), and, most strikingly, overturned 80.7 percent of the denials that were appealed, even as only 11.5 percent of denials were ever appealed. Against other public benchmarks, a 7.7 percent denial rate is below average but still affects millions on Americans: Medicaid managed-care plans denied about 12.5 percent of prior-authorization requests in the most recent federal review, traditional fee-for-service Medicare applies prior authorization to so few services that a comparable rate barely exists, and for claims rather than prior authorization, ACA marketplace insurers denied 19 percent of in-network claims in 2024, with an industry-wide average around 16 percent across commercial plans. The level alone is hard to grade; the overturn rate is the grade: whatever the right denial rate is, a process reversed four times out of five on appeal is not a close call. It is a signal that the initial decision was frequently wrong, and that the appeal process functions as an unfunded tax on physicians and patients with the time and resources to fight.
Who bears the burden for prior authorization denials? An appeal requires phone calls during business hours, faxed records, and the persistence to wait out a process designed to discourage it—resources that are scarcest for low-income, less-educated, and sicker enrollees. When fewer than one denial in eight is ever challenged, the unchallenged denials fall disproportionately on the people with the least capacity to push back, which means a low appeal rate is not a sign that denials were correct, but a measure of how many patients gave up. This distributional reality—that the same wrongful denial is an inconvenience for one household and forgone care for another— is why the stakes of everything that follows are highest for poorer Americans..
To be clear, prior authorization has a legitimate function, and denial is the right answer when the evidence does not support the request. But the premise that America’s health care spending problem is a volume problem—that Americans simply consume far more care than their international peers and therefore need aggressive gatekeeping—is largely wrong. For two decades, research has shown for two decades that on most measures of use—physician visits, hospital days, beds per capita—the United States sits at or below the median of comparable countries. What is dramatically higher is the price of each unit of care, not the quantity. That matters here: a review apparatus built to police volume, in a system whose cost problem is mostly prices, will inevitably deny some appropriate care while leaving the price problem untouched. This paper’s central finding is the sharpest version of that irony: an insurer paying its own providers above-market prices while throttling the volume of everyone else’s. The subject of this paper is therefore narrow: an overturned denial is not utilization management; it is error at industrial scale.
This analysis treats prior-authorization burden primarily as a transparency and market-structure problem rather than a case for blunt prohibition. The disclosures created by CMS-0057-F are, in principle, exactly the kind of market information that lets purchasers, regulators, and the public discipline bad behavior. In practice, as we show, the rule mandated that plans post information, but not where or in any standardized form. A June 2025 administrative rollback narrowed the requirements further, dropping a planned health-equity analysis, reducing MA reporting from the plan level to the contract level, and removing AI-oversight provisions. The result is that data is technically public but practically difficult to use. This paper highlights the need for mandated plan-level approval and denial rate filing into one standardized, public repository.
Prior Authorization and Vertical Integration
A natural question sits beneath the numbers: what is prior authorization for? If it were a neutral clinical screen, the corporate ownership of the ordering physician should not affect whether a request is approved. If it is a financial control, then a vertically integrated insurer—one that also owns the providers—should treat care delivered inside the corporate family differently from care it must purchase outside it. The largest insurers are now exactly this kind of organization: UnitedHealth Group operates more than 2,600 subsidiaries, owns the largest claims clearinghouse, controls roughly one-fifth of the pharmacy-benefit market through Optum Rx, and, through Optum, is aligned with more than 90,000 physicians. All this comprises close to one-tenth of the U.S. physician workforce. These verticals are not unique, as CVS owns Aetna, Cigna houses Express Scripts, and Elevance operates Carelon.
What the disclosures can and cannot show
The CMS-0057-F data cannot test the integration hypothesis directly: filings are aggregated across all services and do not breakdown whether the ordering provider is owned by the insurer. Measuring an internal-versus-external denial differential requires claims-level data—a state all-payer claims database, or Medicare Advantage encounter data—linked to a provider-ownership crosswalk that flags insurer-affiliated NPIs. That is a tractable study, and a worthwhile next step, but it is not in these filings.
The motive, however, is documented through the price channel, which is the same incentive viewed from the other side. A 2025 Health Affairs study using CMS payer price-transparency data found that UnitedHealthcare pays its own Optum-owned practices about 17 percent more than comparable non-Optum practices relative to what rival insurers pay, and 61 percent more in markets where UnitedHealthcare holds at least one-quarter of the market. The authors and others read this as a way to satisfy medical-loss-ratio floors while keeping the money inside the corporate family: paying an affiliated provider more counts as “medical care” for the 80–85 percent spending requirement, yet the dollars never leave the parent company. The implication for prior authorization is straightforward. When the insurer profits from care delivered by its own providers but bears the full cost of care it must buy outside, prior authorization becomes the throttle on external spend.
This is the crux of the argument, so it is worth stating plainly. Federal law forces insurers to spend a minimum share of every premium dollar—80 to 85 percent—on medical care rather than on profit and overhead, a rule known as the medical-loss-ratio. The rule was meant to cap what insurers keep. But when the insurer also owns the doctors, it can satisfy the rule by paying its own subsidiary generously: that payment counts as “medical care,” yet the money stays inside the parent corporation as revenue to another division. Care delivered by an owned provider therefore helps the insurer clear a federal requirement, while identical care purchased from an outside provider is pure cost. Prior authorization is the lever that sorts the two. The result this paper documents—denials falling away precisely where the insurer owns the doctors—is what that incentive looks like in practice: a transparency rule and a profit cap, both designed to protect patients, being used as a tool that decides whose care gets approved based on who profits from it.
The behavioral breadcrumbs point the same way. UnitedHealthcare has removed prior-authorization requirements for home-health services administered by its own Optum Home & Community unit, and is routing categories such as oncology prior authorization through Optum-operated portals; its Gold Card program waives prior authorization for groups with sustained high approval rates, a design that structurally advantages the large, integrated groups best positioned to clear the bar. And the clearest within-integration signal already sits in our dataset: Kaiser Permanente, where the payer and the provider are the same organization, posts an appeal rate of just 1.6 percent, roughly one-seventh of the industry’s.
The Integration Hypothesis
The integration hypothesis yields a prediction testable with data already in this paper. UnitedHealthcare’s 63 MA contracts span denial rates from under 2 percent to 23 percent (Figure 4), and each contract serves a defined geography. Optum’s ownership of the local delivery system also varies enormously by geography from negligible to as much as 44.9 percent of a county’s primary-care market. If prior authorization functions as a throttle on external spend, UnitedHealthcare’s denial rate should be systematically lower in service areas where more of the care it covers is delivered by providers it owns. If prior authorization is a neutral clinical screen, an insurer’s denial rate should not depend on who owns the providers; if it is a financial control, the insurer should say yes more readily where the spending stays inside the corporate family. That yields two predictions the data can check: first, UnitedHealthcare’s denial rates should fall as Optum’s share of local physicians rises; second, rival insurers facing the same patients in the same places should show no such gradient. Both are tested below.
The test regresses each contract’s initial denial rate on the enrollment-weighted Optum share of its service-area counties, weighted by request volume. The ownership variable counts physicians, not organizations: individual physicians who formally reassign their Medicare billing to an Optum-owned group (identified in PECOS reassignment data and located by practice county), divided by all physicians with reassignments in the county. This measures employment; looser affiliations—most notably California’s IPA arrangements—do not appear, so the variable understates Optum’s total alignment.
Results
The index
Table 1 presents the standardized metrics for every entity currently in the dataset. Figure 1 ranks them by projected wrongful-denial rate, with the published benchmarks shown for reference. UnitedHealthcare’s full Medicare Advantage book carries a projected wrongful-denial rate of 7.6 percent—above the Medicare Advantage industry benchmark.
| Insurer | Scope | Requests | Denial rate | Appeal rate | Overturn rate | Confirmed wrongful (rate) | Projected wrongful (rate) |
| UnitedHealthcare | Full MA book — 63 H-contracts | 8,593,632 | 12.9% | 9.9% | 57.7% | 63,314 (0.74%) | 652,771 (7.60%) |
| Humana | Full MA book — 32 H/R contracts | 9,831,435 | 6.9% | 2.6% | 64.7% | 11,449 (0.12%) | 438,271 (4.46%) |
UnitedHealthcare: the advertised rate and the filed rate
UnitedHealthcare’s public-facing page reports that 95.4 percent of Medicare Advantage prior authorizations were approved—an implied 4.6 percent denial rate—and frames prior authorization as rarely consequential. Its own contract-level filing, linked from the same page, tells a different story. Across all 63 MA contracts, weighting by volume, the initial denial rate is 12.9 percent—nearly three times the headline. The gap is largely definitional: the headline counts approvals after appeal as approvals and blends lines of business, while the filing reports initial determinations by contract. The company even includes a footnote acknowledging that its summary rates differ from the figures in the CMS-required reports.
The contract-level view also reveals a spread that any single rate conceals. Figure 2 sorts UnitedHealthcare’s 63 MA contracts by denial rate. They range from under 2 percent to 23.0 percent on the single largest contract (H2001, 1.93 million requests, 443,380 denials),meaning the contracts with the most members are not uniformly the gentlest. Two readings of that spread deserve stating. First, nothing in this paper assumes insurers are always wrong to deny; the yardstick for wrongness throughout is the insurer’s own reversal on appeal. Second, the spread itself is the tell: these contracts operate under the same federal rules and the same corporate policies, so if a 2 percent denial rate polices utilization adequately in one market, a rate ten times higher next door is a management choice demanding explanation—and H2001’s 23 percent travels with a 56 percent overturn rate, meaning the plan takes back more than half of the denials patients contest, which is difficult to square with 23 percent of requests being genuinely unsupported. The volume-weighted mean (12.9 percent) and the KFF industry benchmark (7.7 percent) are marked for reference.
Greater Ownership, Lower Rates of Prior Authorization
Across the 59 UnitedHealthcare contracts matchable to geography, contract-level Optum physician share ranges from 0 percent to 8.9 percent (median 0.7 percent). The volume-weighted regression yields a slope of −4.34 (p<0.001). In plain English, each percentage point of Optum’s local physician share is associated with roughly a 4.3-percentage-point lower UnitedHealthcare denial rate. Moving across the observed range corresponds to a predicted gap larger than most of the spread in Figures 3 and 4 below.
The direction is exactly what the favoritism hypothesis predicts. The magnitude, taken literally, is too large to be a pure ownership effect, which is why we report it alongside three candidate interpretations, the third of which we test directly. First, measurement: because employment-based shares understate true alignment, the per-unit slope is mechanically inflated. Second, delegation: in Optum-dense markets, utilization management is often delegated to the medical group itself under capitation, so denials may occur inside the group and never surface in the plan’s filings. In other words, care management moving in-house and out of public view, which is consistent with the integration thesis but a different mechanism than fewer denials. Whether those in-house determinations are more accurate is unknowable from public data, which is itself the point. Delegation currently moves utilization management outside the disclosure regime entirely, and extending the reporting requirement to delegated entities is the obvious fix. Third, geography: Optum-dense markets may differ in case mix or plan design. We test geography directly with a placebo—a rival insurer’s denial rates regressed on the same Optum shares in the same geography—implemented with Humana, the second-largest MA insurer, using the identical construction on Humana’s own CMS-0057-F contract filings (Section 2.3).
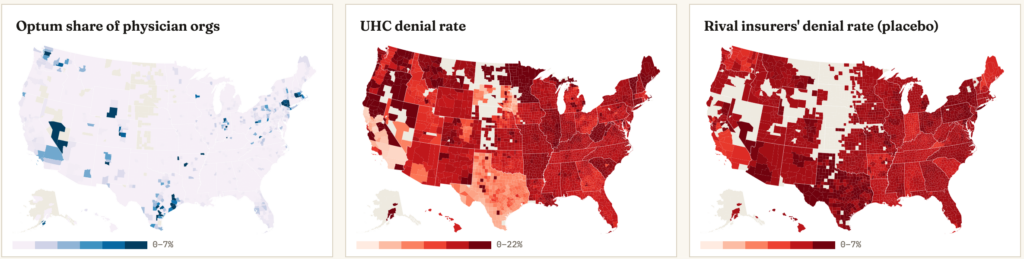
The placebo is null: across 31 Humana contracts spanning an even wider Optum-share range (0 percent to 15.2 percent), the slope is −0.22 (permutation p=0.72), twenty times smaller than UnitedHealthcare’s −4.34 and statistically indistinguishable from zero. Where UnitedHealthcare’s denial rates fall steeply with Optum’s local presence, Humana’s do not move; Figures 1 and 2 show the comparison directly. This rules out the geographic explanation: whatever drives the gradient operates only on the insurer that owns the doctors. Humana’s own smaller provider arm, CenterWell, biases the placebo against this conclusion, making it conservative. What the placebo cannot separate is favoritism from parent-specific delegation—i.e., Optum groups may hold delegated contracts disproportionately with their parent, moving denials in-house and out of the public filings—but both are integration effects, in which prior authorization eases where the insurer owns the delivery system.
The human meaning of that gradient is tangible. A Medicare Advantage enrollee’s odds of having a scan, a specialist referral, or a skilled-nursing stay approved on the first try depend in part on something they never chose and cannot see: whether their insurer happens to own physicians in their county. Enrollees in Optum-heavy areas are not getting better care: they are getting fewer denials of the same care, while comparable patients elsewhere face a gauntlet of approvals. Because lower-income seniors are concentrated in Medicare Advantage and are the least equipped to appeal, the denials that do not ease are the ones most likely to end in forgone care. The reform this gradient implies is the second recommendation: require approval rates to be reported for affiliated and non-affiliated providers separately, so the pattern reconstructed here from scattered filings is visible, plan by plan, in every insurer’s own disclosure.
Wrongful denials, confirmed and projected
Of UnitedHealthcare’s 1.11 million initial MA denials, only about 109,600 (9.9 percent) were appealed, and of those, 57.7 percent were overturned. (The denominator, for scale: 1.11 million denials came out of 8.59 million total requests—the 12.9 percent denial rate reported above). That yields 63,314 confirmed wrongful denials, that is, care denied and then reinstated by the plan’s own review. If the unappealed denials were wrongful at the same rate, the projected total rises to roughly 653,000. The filings provide no breakdown by type of service. Imaging, clinic-administered drugs, and post-acute stays are blended into one number, so which kinds of care these reversals represent cannot be gleaned from the public data. The only service-level window available is the subpoenaed post-acute evidence below. The distance between those two numbers is the cost of a low appeal rate: hundreds of thousands of plausibly improper denials that were simply never contested.
Humana’s filings tell a similar story at lower intensity but with sharper suppression. Of its 677,179 initial MA denials, just 17,690 (2.6 percent) were appealed (one quarter of UnitedHealthcare’s appeal rate and far below the industry’s 11.5 percent benchmark), yet 64.7 percent of those appeals succeeded, yielding 11,449 confirmed and roughly 438,000 projected wrongful denials. Under the index’s appeal-suppression flag, Humana’s numbers must be read together: it denies half as often as UnitedHealthcare, but its denials are almost never contested, and when contested they usually fall. The gap between confirmed and projected wrongfulness is widest where challenge is rarest. Hence the third recommendation: the overturn rate, read alongside the appeal rate, is the accountability metric that should carry consequences.
The administrative cost of prior authorization
Combining Medicare Advantage volume with CAQH per-transaction costs yields an estimate of $510–$580 million per year in combined provider- and payer-side administrative spending just to process Medicare Advantage prior authorizations—before counting Medicaid, CHIP, or commercial coverage, and not counting the clinical cost of delayed or forgone care. An alternative implied here is approving everything, which would invite genuine overuse and cost far more than it saved. Instead, targeted review, (which exempts the services and providers with near-universal approval histories as “gold card” programs already do) would maintain screening for truly frivolous care while eliminating most of the transactions. For context, physicians report processing roughly 39 prior authorizations per week, consuming about 13 hours of staff time, with the large majority saying the process delays care.
Why only two insurers (so far)
The index names only UnitedHealthcare and Humana because they are, at this writing, the only major insurers whose complete MA filings could actually be retrieved, and the reasons the others could not be found are themselves noteworthy. Aetna/CVS filed roughly 59 plans, according to third party tallies, but its public statistics page covers only commercial plans while the federally required MA report sits behind a member/provider login on a domain. Elevance/Anthem’s posting could not be located at all. CMS’s centralized collection of this dat —the route that would cover every insurer at once—stopped being freely public after contract year 2021. Recent years are released only as a fee-and-data use agreement limited data set. The two insurers we do observe are the two largest in Medicare Advantage, together processing 18.4 million prior-authorization requests in 2025, but the selection is not random: insurers that post accessibly may differ systematically from those that obscure their filings, a caveat that applies to every cross-insurer comparison here.
Where denials concentrate: the post-acute evidence
Aggregate denial rates understate the problem because denials are not spread evenly across services but rather concentrate where care is most expensive. The Senate Permanent Subcommittee on Investigations, drawing on more than 280,000 pages of internal documents from the three largest MA insurers, found that UnitedHealthcare’s prior-authorization denial rate for post-acute care nearly tripled from 8.7 percent in 2019 to 22.7 percent in 2022—roughly three times its overall denial rate—with skilled-nursing-facility denials rising ninefold (1.4 percent to 12.6 percent). Humana’s post-acute denial rate reached 24.6 percent in 2022. CVS/Aetna held the highest post-acute rate of the three (25.9 percent in 2022, against a 9.3 percent overall average) while expanding the number of services subjected to prior authorization by 57.5 percent. What accounts for the concentration is not mystery but incentive: post-acute care—skilled nursing, inpatient rehabilitation, long-term hospital stays—combines a high cost per episode with genuine clinical discretion over setting and length of stay, making it the highest-yield target for utilization review. The subpoenaed documents show the insurers treated it exactly that way, deploying predictive tools and targeted initiatives against these services as deliberate cost-control strategies. Figure 5 plots the divergence.
Transparency in form, opacity in practice
The single most consistent finding across the filings is their inconsistency. CMS specified the metrics but not their location or format. UnitedHealthcare publishes one consolidated PDF; Humana splits its disclosure into 32 separate documents behind a JavaScript-rendered provider page, and other large insurers gate theirs behind portals entirely. Each payer also computes on its own terms, and several disclaim that their posted figures may differ from what they file with regulators. Aetna is the extreme case so far; its only public prior-authorization statistics cover commercial plans, while the federally required Medicare Advantage report appears to sit behind a member/provider login on a domain that also blocks automated access. So even though aggregators confirm Aetna filed, its primary MA figures are effectively unretrievable by the public the rule was meant to inform. The data are public; they are not yet usable. Table 2 records the current state of collection and the path to completeness.
| Entity | Market | Status | Access / format | Source |
| All MA contracts (~700+) | MA | pending | CMS Part C Reporting Requirements data | cms.gov |
| UnitedHealthcare | MA | primary | CMS-0057 filing: single consolidated PDF (63 contracts) + PSI post-acute data | uhc.com |
| CVS / Aetna | MA | partial | Service-line primary data via Senate PSI subpoena; CMS-0057 MA posting not publicly retrievable | Senate PSI (PDF) |
| Humana | MA | primary | 32 per-contract documents harvested via browser automation (JS-rendered page); 9 Medicaid state files excluded from MA analyses | humana.com |
| Elevance / Anthem | MA | pending | Covered by CMS Part C data (Layer 1); website posting not yet located | — |
| Medicaid managed care | Medicaid | benchmark | OIG plan-level review: 12.5% denial rate; 2.7M denials; 12 of 115 MCOs above 25% | oig.hhs.gov |
Policy recommendations
Three policy recommendations follow from the above analysis.
Standardize the disclosures. CMS has already defined the fields and layout in its own metrics-reporting template. This recommendation would require every plan to submit that same template as structured data to one central, downloadable CMS repository, which is the same infrastructure CMS already operates for Part C reporting requirements data. No new schema needs to be invented; only the filing location and file format need to be mandated. A reporting mandate without a machine-readable schema and a single filing location produces transparency theater. CMS already publishes a metrics template; requiring submission to a central, downloadable repository in a fixed format—ideally with the counts CMS has separately proposed adding— would convert a scavenger hunt into a usable public dataset at near-zero cost to plans already computing the numbers.
Using the overturn rate as an accountability lever for payors. An overturn is the plan conceding error. Persistently high overturn rates – defined as an overturn rate at or above 50 percent with half or more of a plan’s contested denials reversed – sustained across at least two consecutive annual reporting cycles should result in dedicated review of a payor’s denial patterns. This timeframe distinguishes a systemic pattern from a single bad year. Error runs in the other direction too—approving care that should have been denied—but such errors already have a federal apparatus of improper-payment measurement and payment-integrity audits. The overturn rate is the only public measure of improper denials.
Accountability should be clear and meaningful. Plans with overturn rates that stay persistently high should face escalating consequences, including targeted audits, corrective-action plans, star-rating penalties that affect bonuses and enrollment, and – for the worst offenders – suspending prior authorization for the service lines the plan keeps getting wrong.
Trim the paperwork, not the policy. Trimming genuinely duplicative paperwork is fine, and nothing should be reported solely for its own sake. Rather, the government should restore three specific tranches of information lost: plan-level rates that were collapsed into coarser contract-level aggregates); the health-equity population breakdown, and disclosure of the algorithmic tools used to make determinations. Each of these removed information available nowhere else.
The June 2025 retreat from plan-level reporting, health-equity analysis and AI-oversight provisions removed exactly the granularity that makes the data actionable. Without population detail—such as dual-eligibility status, disability status, and income band—it is impossible to see whether denials concentrate among specific groups, including the most vulnerable and poorest enrollees. These are disclosure requirements, not coverage mandates, and they are the difference between a market that can discipline bad prior-authorization practice and one that cannot.
Regardless, there is direct evidence that the burden of denials falls hardest on low-income patients. A 2025 Health Affairs study using a national dataset of private-insurance claims found that patients with household incomes below $50,000 were the least likely to contest a denied claim and, when they did contest it, the least likely to win. An earlier study by the same researchers found low-income patients were 43 percent more likely than high-income patients to have claims denied in the first place for routine preventive care. The pattern documented nationally elsewhere in this paper—a process that requires time, paperwork fluency, and persistence to contest—is one where lower income Americans are disadvantaged at every stage of prior authorization.
There is also a direct fix for insurer’s methods of skirting the medical loss ratio. Because the medical-loss-ratio lets an insurer count payments to its own subsidiaries as “medical care,” the rule meant to limit insurer profit instead rewards keeping spend in-house, and it rewards using prior authorization to suppress spend everywhere else. Requiring insurers to report prior-authorization approval rates separately for affiliated and non-affiliated providers would make the favoritism visible in every plan’s own filing, and would let regulators treat a large internal-versus-external gap as the red flag it is.
Would separating internal and external denials restrain spending? Disclosure alone caps nothing directly, but the loophole it exposes is itself inflationary. Paying one’s own subsidiary above market rates raises the premiums everyone pays, so making the self-dealing visible is the precondition for the regulatory or competitive pressure that squeezes it out. Absent that, the patients who lose are predictable: the lower-income enrollees, disproportionately served by these plans, whose denied care is least likely to be appealed and most likely to be abandoned.
This evidence also bears on live policy. CMS’s WISeR model—which faces potential repeal by Congress—is now importing prior authorization into traditional Medicare for selected services in six states. Congress continues to weigh proposals that would penalize plans whose initial denials are overturned too often. A clean, comparable overturn metric is the prerequisite for any such accountability rule to function as intended.
Conclusion
CMS-0057-F pried open a process that had been opaque for a generation, and even a partial reading of the first disclosures is clarifying. One insurer’s filing shows a denial rate nearly three times what it advertises, tens of thousands of denials it reversed on its own review, and critics can reasonably assume hundreds of thousands more were likely improper but never contested. The data needed to hold this system accountable now exist. The remaining work is to make them usable: require every plan to file its metrics in one standardized, machine-readable public repository; require approval rates to be reported separately for insurer-owned and independent providers, so integrated self-dealing is visible in every filing; and attach escalating consequences to persistently high overturn rates:the system’s own admission of error.
What is ultimately at stake is not a statistic but people: the Medicare Advantage enrollees who are told no, who lack the knowledge, hours, and the wherewithal to appeal, and who consequently go without care. Meanwhile, a few counties over, a patient whose doctor the insurer happens to own is quietly told yes. A rule written to make insurers spend on care, and a rule written to make their denials public, should not add up to a system that decides whose care is worth approving by who profits from delivering it. Making these disclosures usable is the first step toward making that bargain visible—and toward ending it.
Appendix — A design to measure the internal/external denial differential
The following provides the methodology for the analysis above.
The Wrongful-Denial Index
For each reporting entity we standardize the disclosures to three rates: a denial rate (denials ÷ total requests), an appeal rate (appeals ÷ denials), and an overturn rate (overturns ÷ appeals). From these we compute two bounded estimands rather than a single, falsely precise score. The confirmed wrongful-denial rate is the share of all requests that were denied, appealed, and then overturned. It is a hard floor, and a low one, because the large majority of denials are never appealed at all.
The projected wrongful-denial rate multiplies the denial rate by the overturn rate, treating the appeal as a random audit of all denials and assuming that unappealed denials were wrongful at the same rate as appealed ones. This is the more policy-relevant figure, but it carries a real assumption that we state wherever it appears: it may overstate if physicians selectively appeal their strongest cases, or understate if they abandon valid appeals because the administrative cost is not worth it, which is the documented reality behind a single-digit appeal rate. The truth lies between the two bounds, and both are reported. One asymmetry deserves note. These disclosures illuminate only one direction of error: approving care that should have been denied is also real and also costly, but wrongful approvals are already policed by an extensive federal apparatus of improper-payment measurement and payment-integrity audits, while wrongful denials had no public measurement at all until these filings. The index addresses the asymmetry in oversight, not an assumption about the asymmetry in error.
Guardrails
The index is deliberately not a ranking engine that treats every plan identically. Four guardrails apply. Appeal-suppression: a low appeal rate paired with a high denial rate means the confirmed estimate badly understates reality and is flagged. Integrated structure: in integrated systems the requester and the payer are often the same organization, collapsing the adversarial appeal dynamic, so their rates are annotated and not ranked head-to-head with network plans. Denominator mismatch: figures reported at the member level rather than the request level are excluded from comparison, not silently blended. Market segmentation: MA, Medicaid managed care, and exchange plans operate under different appeal backstops and are compared within, not across, markets.
Data architecture: three layers, three source tiers
The dataset is organized in three layers. Layer 1 (universe) is CMS’s Part C Reporting Requirements data: CMS collects contract-level organization-determination and reconsideration data (volumes, dispositions, reopenings) from every MA contract and releases it annually, the same data underlying KFF’s industry analyses. This layer covers every insurer centrally, with no dependence on payer websites. Layer 2 (audit) is the CMS-0057-F website disclosures themselves, used not as the primary source but as a compliance check: comparing what each insurer posts publicly against what it files with CMS, and recording postings that cannot be retrieved at all. Layer 3 (depth) is service-line and oversight evidence the aggregate files lack: the Senate PSI’s subpoenaed post-acute denial data, the HHS-OIG clinical audits, and the OIG’s Medicaid managed-care review.
What the insurer data are, and how they were gathered
All insurer-level figures in this paper are Medicare Advantage prior-authorization metrics for calendar year 2025, disclosed under CMS-0057-F: counts of standard and expedited prior-authorization requests for medical items and services, initial denials, appeals, and requests approved only after appeal. Part D drug prior authorizations are excluded by the rule and are not in these data. Medicaid is analyzed separately from federal sources and never pooled with MA. Reporting is at the contract level. “H” contracts are local MA plans (including special-needs plans) and “R” contracts are regional PPOs, and the numbers are self-reported by the insurers and unaudited.
UnitedHealthcare posts a single consolidated PDF covering its 63 MA H- and R-contracts. We parsed every contract’s total cases, initial denials, and approvals-after-appeal programmatically and aggregated by volume weighting — summing counts across contracts rather than averaging rates — so that a 1.9-million-request contract counts proportionally more than a 285-request one. As validation, our volume-weighted denial rate of 12.9 percent closely matches the ~13.2 percent reported independently from the same filings.
Humana posts its metrics as 32 separate per-contract documents on its provider website, behind a JavaScript-rendered page that defeats simple retrieval. These were retrieved via development of custom data parsers validated against an independent insurer’s filing in the same format. Humana also posts nine state Medicaid metric files on the same page. These are excluded from every MA analysis in this paper to keep the market scope clean. Both insurers’ per-contract extracts ship with the paper’s replication pipeline.
Administrative-cost estimate
To size the administrative burden, we combine prior-authorization volume with per-transaction processing cost. We multiply KFF’s Medicare Advantage volume by CAQH Index per-transaction costs for providers and payers, blended by the share of prior authorizations conducted electronically (about 40 percent). We report a range across CAQH vintages rather than a point estimate, and the figure is scoped to Medicare Advantage; a national figure would require total medical prior-authorization volume across all payers.
The integration test: variable construction and estimation
No registry lists which physicians an insurer owns, so we construct one from Medicare’s enrollment infrastructure. From the CMS Public Provider Enrollment (PECOS) base file we identify organizational enrollments whose legal business names match a curated list of thirty Optum-owned medical-group entities (WellMed, Kelsey-Seybold, Atrius, Optum Medical Care, HealthCare Partners, and others), with an exclusion list for known near-name false positives. The PECOS reassignment sub-file maps each individual physician’s enrollment to the group practice that bills for them. A physician is attributed to Optum if they reassign billing to at least one matched group. This attributes roughly 17,000 physicians nationally — an employment-based measure that by construction excludes looser affiliations (notably California’s IPA arrangements) and therefore understates Optum’s total alignment. The match was audited by attributed-physician counts per organization. All major Optum medical groups appear at plausible magnitudes.
Each attributed physician is located by the practice address of their NPPES record, mapped from ZIP code to county using the HUD USPS crosswalk. The county-level Optum share is defined as attributed physicians divided by all physicians with billing reassignments in that county. Counties with fewer than ten reassigned physicians are suppressed. Each UnitedHealthcare contract’s exposure is the enrollment-weighted mean of county shares across its service area, using CMS’s monthly enrollment-by-contract-and-county file. Contracts with under half of enrollment in share-covered counties are excluded, leaving 59 of 63.
The outcome is each contract’s initial prior-authorization denial rate from UnitedHealthcare’s CY2025 CMS-0057-F filing (Section 2.3). We estimate a weighted least squares regression of contract denial rate on contract Optum share, weighting by request volume so that a 1.9-million-request contract counts proportionally more than a 285-request one.
In plainer terms, the analysis asks a simple question — does UnitedHealthcare say no less often in places where it owns more of the doctors? — and answers it by lining up two maps of the country, county by county. The first map is how much of the local medical care UnitedHealthcare effectively owns. We could not buy a list of “Optum doctors,” because none exists, so we rebuilt one from public Medicare records: every physician tells Medicare which group practice bills on their behalf, so we matched those group names to Optum’s known medical groups (WellMed in Texas, Kelsey-Seybold in Houston, the old Everett Clinic in Washington, and so on), counted how many doctors in each county belong to one, and divided by all the doctors in that county. That gives each county a percentage — Optum’s share of the local physician supply. The second map is how often UnitedHealthcare denies care in that same county, which we built from the company’s own filing: each of its 63 Medicare Advantage contracts reports its denial rate, and because we know which counties each contract covers and how many members it has in each, we can spread those denial rates down to the county level, weighting by where the members actually are. With both maps in hand, the test is whether the counties shaded darker for Optum ownership tend to be the counties shaded lighter for denials. They are — strongly for UnitedHealthcare, and not at all for Humana, which is the comparison that tells us the pattern is about ownership rather than about which places happen to be easygoing for everyone.
Appendix Tables
Table A1 (excerpt) — Counties with the highest Optum physician share
| County | Optum share | UHC denial rate | UHC requests |
| Snohomish, WA | 37.7% | 15.2% | 27,711 |
| Sullivan, NY | 31.0% | 19.5% | 943 |
| Teller, CO | 30.8% | 11.2% | 2,010 |
| Putnam, NY | 30.7% | 21.3% | 1,848 |
| Orange, NY | 26.6% | 20.5% | 4,361 |
| Miami, IN | 18.2% | 19.1% | 1,140 |
| Dutchess, NY | 17.9% | 21.6% | 7,111 |
| Valencia, NM | 15.2% | 18.7% | 1,776 |
| Brazoria, TX | 12.0% | 7.5% | 17,825 |
| Norfolk, MA | 11.9% | 16.1% | 7,867 |
| Jim Wells, TX | 11.1% | 5.2% | 5,472 |
| San Patricio, TX | 10.5% | 5.0% | 8,199 |
| Bee, TX | 10.5% | 6.9% | 2,997 |
| Nye, NV | 10.3% | 9.3% | 3,374 |
| Floyd, IN | 10.0% | 21.9% | 952 |
| Clay, AR | 10.0% | 21.2% | 380 |
| Fort Bend, TX | 9.9% | 7.6% | 35,631 |
| Clark, NV | 9.9% | 9.1% | 93,523 |
| Worcester, MA | 9.7% | 17.3% | 6,717 |
| Hancock, IN | 9.6% | 20.1% | 2,369 |
| Walker, TX | 9.6% | 15.5% | 3,408 |
| Montgomery, TX | 8.8% | 8.3% | 27,986 |
| Yell, AR | 8.3% | 20.8% | 612 |
| Adair, OK | 8.3% | 16.0% | 806 |
Full 3,049-county table, including the Humana placebo-control column, available on request.
Table A2 — Prior-authorization scorecard: top UHC contracts by projected wrongful denials
| Contract | Requests | Denial rate | Overturn rate | Projected wrongful |
| UHC H2001 | 1,928,959 | 23.0% | 56.4% | 250,066 |
| UHC H5253 | 665,291 | 18.7% | 55.7% | 69,177 |
| UHC H2406 | 449,332 | 16.4% | 61.5% | 45,441 |
| UHC H0609 | 801,389 | 6.8% | 81.6% | 44,744 |
| UHC H8768 | 324,368 | 20.1% | 55.0% | 35,774 |
| UHC H2802 | 210,477 | 20.3% | 56.9% | 24,345 |
| UHC H0543 | 1,780,998 | 1.9% | 70.5% | 23,486 |
| UHC H1889 | 189,499 | 17.3% | 55.4% | 18,198 |
| UHC H1045 | 199,375 | 17.4% | 48.2% | 16,762 |
| UHC H4514 | 254,650 | 4.6% | 93.1% | 10,975 |
| UHC H3805 | 114,032 | 14.0% | 63.6% | 10,133 |
| UHC H0294 | 96,371 | 19.5% | 50.8% | 9,561 |
| UHC H4604 | 96,375 | 13.7% | 70.8% | 9,339 |
| UHC H4527 | 292,338 | 3.3% | 94.4% | 9,041 |
| UHC H1278 | 237,430 | 4.3% | 87.5% | 8,933 |